![]()
![]()
![]()
![]()
![]()
![]()
![]()
![]()
![]()
![]()
![]()
|
On the characterization of energy 1Departamento de Ciência da Computação, UFMG, Belo Horizonte, MG, Brasil 2Departamento de Bioquímica e Imunologia, UFMG, Belo Horizonte, MG, Brasil 3Instituto de Informática, PUC Minas, Betim, MG, Brasil 4Departamento de Química, UFMG, Belo Horizonte, MG, Brasil Corresponding author: C.J.M. Veloso E-mail: [email protected] Genet. Mol. Res. 6 (4): 799-820 (2007) ABSTRACT. The construction of a realistic theoretical model of proteins is determinant for improving the computational simulations of their structural and functional aspects. Modeling proteins as a network of non-covalent connections between the atoms of amino acid residues has shown valuable insights into these macromolecules. The energy-related properties of protein structures are known to be very important in molecular dynamics. However, these same properties have been neglected when the protein structures are modeled as networks of atoms and amino acid residues. A new approach for the construction of protein models based on a network of atoms is presented. This method, based on interatomic interaction, takes into account the energy and geometric aspects of the protein structures that were not employed before, such as atomic occlusion inside the protein, the use of solvation, protein modeling and analysis, and the use of energy potentials to estimate the energies of interatomic non-covalent contacts. As a result, we achieved a more realistic network model of proteins. This model has the virtue of being more robust in face of different unknown variables that usually are arbitrarily estimated. We were able to determine the most connected residues of all the proteins studied, so that we are now in a better condition to study their structural role. Key words: Protein structure, Complex networks, Myoglobins INTRODUCTION The principles of protein folding that result in a balance of stability and flexibility, while maintaining its function, are not perfectly understood and have been difficult to exploit for the development of thermo-stabilized proteins. A key mechanism for thermo-stabilization appears to be the optimization of interactions between atoms within a protein. The underlying principles of protein stability and folding have been studied by a variety of analyses of a large number of different protein structures. Some theoretical studies of protein structures and other empirical methods have been used to understand the stability of proteins. Hitherto, different kinds of experiments have been carried out to understand the stability of proteins, and to determine whether any specific residues exist that could be identified as playing a relevant role in the phenomenon (Fersht and Daggett, 2002; Onuchic and Wolynes, 2004). Protein structure networks have been modeled based on varying concepts of nodes and edges (Vendruscolo et al., 2002; Bagler and Sinha, 2005). These previous studies focused on understanding network properties, such as shortest path length and clustering coefficient, and other properties. Similarly, in this study, the protein structures are modeled as networks and the representative graph of protein structure (RGPS) is constructed by defining the constituent atoms of amino acid residues in the polypeptide chain as the vertices and the non-covalent interactions among them as edges.
Modeling proteins as graphs has been used in the identification of clusters of atoms that could stabilize the protein structure. An important feature of such graph is the definition of edges based on the energy of interaction between the atoms in proteins. In order to deal with the reported dependence on the cut-off value of the interaction distance between atoms used in such graph construction (Vendruscolo et al., 2002; Greene and Higman, 2003; Atilgan et al., 2004; Bagler and Sinha, 2005), the spatial occlusions among the atoms are analyzed. Such approach suggests that the subjacent protein network should be different from those previously reported. Other important features that must be identified are the highly connected atoms and the crucial residues for the stability of the protein structure network. These elements constitute the "hubs" of the protein network. An important, but not exclusive, aspect of these elements is that many other real-world networks are known to be resilient to random attacks on nodes but very susceptible to targeted attacks on hubs (Barabasi, 2002). In such way, some specific mutations of the hub residues can lead to the rupture of the protein structure. Finally, we have demonstrated that the network parameters are able to classify the protein according to its folding family. Thus, we believe that this study will be able to motivate new experiments in protein structure.
This study focuses on understanding the principles of protein structure by considering them as complex networks of noncovalent interactions. We adopt a novel approach on how protein structures could be modeled, with the energy of atomic interactions and the spatial occlusions among them playing important roles in determining the characteristics of the network. In this study, we also showed the need of solvation of the protein before the analysis of the atomic interactions, in order to avoid unrealistic results when no cut-off value is used to limit the distance between the atoms when their interaction is calculated. Concomitantly, the residues exposed to the solvent tend to show an excessive number of links established with other atoms on the surface of the protein. The solvation of the protein mimics more realistically the scope where this kind of interaction happens. Therefore, the number of links among the atoms decreases drastically and the mathematical patterns of the resulting network become more realistic. COMPLEX NETWORK THEOTETICAL REVIEW In recent years, some relevant studies have applied the principles of networks for modeling complex systems, such as in epidemiological processes, social processes, metabolic networks, micro-electronic devices, etc. For networks of tens or hundreds of vertices, it is a relatively straightforward matter to draw a picture of the network with actual points and lines and to answer other specific questions about diverse kinds of network structure by examining this picture. There are some (Newman, 2003) advances towards providing answers to questions related to characterizing and modeling the network structure. On the other hand, studies of the structural effects on system behavior are shown to be still incipient. A central concept when analyzing complex networks is its topology, and two different topological models have been adopted: "small-world" and "power law" models. For instance, the following concept of "small world" topology is adopted in this study: If the number of vertices within a distance r of a typical central vertex grows exponentially with r, and this is true for many networks including the random graph, then the value of the mean geodesic distance between all pairs of vertices l that have a connecting path will increase by log n. The term "small-world effect" has thus taken on a more precise meaning: Networks are said to show the small-world effect if the value of l scales logarithmically or more slowly with network size for a fixed mean degree. Logarithmic scaling can be proved for a variety of network models and has also been observed in various real-world networks. Some networks have mean vertex - vertex distances that increase more slowly than by log n. Bollobás et al. (2001) have shown that networks with power-law degree distributions have values of l that increase no faster than log n/log log n. A small-world network is one that has a relatively short characteristic path length, L, and a high clustering coefficient, C. Small-world models can be built on lattices of any dimension or topology, but the best-studied case by far is the one-dimensional one. If we take a one-dimensional lattice of L vertices with periodic boundary conditions, i.e., a ring, and join each vertex to its neighbors k or smaller lattice spacing away, we get a system, with Lk edges (Newman, 2003). The small-world model is then created by taking a small fraction of the edges in this graph and "rewiring" them (Newman, 2003). The rewiring procedure involves going through each edge in turn and, with probability p, moving one end of that edge to a new location chosen uniformly at random from the lattice, except that no double edges or self-edges are ever created. Furthermore, these features will be important to characterize the structural aspects of the proteins studied. In the next sections, other important features of complex networks will be explained. Transitivity and clustering In the present study, we adopt the concept of clustering C defined as: if a vertex v has kv neighbors, then the maximum number of links between these neighbors is [kv (kv - 1)]/2. The term Cv gives the fraction of these possible links that actually exist, and C is then defined as the average Cv over all vertices v. C is a measure of local clustering, which means that if two vertices X and Y are both connected to a third, Z, then for large C there is a high probability that X and Y are also directly linked to one another. In terms of network topology, transitivity means the presence of a heightened number of triangles in the network (sets of three vertices each of which is connected to each of the others). It can be quantified by defining a clustering coefficient C (Newman, 2003): 
where a "connected triple" means a single vertex with edges running to an unordered pair of others. In simple terms, C is the mean probability that two vertices that are network neighbors of the same other vertex will themselves be neighbors. The clustering coefficient measures the density relationships in a network. An obvious generalization is to also ask about the density of longer loops, that is, loops of length four and higher. The clustering coefficient may identify densely connected groups of vertices and the "hubs" inside these structures. Therefore, the clustering coefficient may provide evidence of a modular view of the network’s dynamics (Holme et al., 2003; Guimerá and Nunes Amaral, 2005). Degree distributions The degree of a vertex in a network is defined as the number of edges incident on (i.e., connected to) that vertex (Newman, 2003). We define pk to be the fraction of vertices in the network that have degree k. Equivalently, it should be expressed:
Although in theory one has just to construct a histogram of the degrees, in practice one rarely has enough measurements to get good statistics in the tail, and direct histograms are thus usually rather noisy. There are two accepted ways to get around this problem. One is to construct a histogram in which the bin sizes increase exponentially with degree. This method of constructing a histogram is often used when the histogram is to be plotted with a logarithmic degree scale, so that the widths of the bins will appear even. Because the bins get wider as we get out into the tail, the problems with statistics are reduced, although they are still present to some extent as long as pk falls off faster than k-1, which it must if the distribution is to be integrable. An alternate way of presenting degree data is to make a plot of the cumulative distribution function
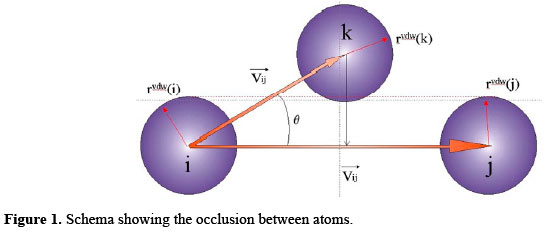
which is the probability that the degree is greater than or equal to k. Such a plot has the advantage that all the original data are represented. When we make a conventional histogram by binning, any differences between the values of data points that fall in the same bin are lost. The cumulative distribution function does not suffer from this problem. The cumulative distribution also reduces the noise in the tail. The degree distribution of a network is interesting as a measure to identify the most connected vertices (i.e., the "hubs") of the network which provide the connectiveness among the existing communities inside the network. Summarizing All the real network topologies discussed in the literature so far - chains, grids, lattices and fully connected graphs - have varied from a completely regular lattice to a quite random lattice. Newman (2003) exemplifies three different types of lattice: regular, random and scale-free. These simple models allow us to focus on the complexity caused by the nonlinear dynamics of the nodes, without being burdened by any additional complexity in the network structure itself (Newman, 2003). Ignoring in this approach the dynamic aspects, it is possible to turn our attention to describing the structural aspects of the more complex architectures. For instance, these previously explained features of the networks will be helpful in characterizing the structure of the proteins studied. MATERIAL AND METHODS Data set The data set used in this analysis consisted of structures of 12 myoglobins obtained from the protein data bank - PDB (Berman et al., 2000). This non-redundant set of proteins with a resolution better than 1.8 Å was submitted to a simulated annealing procedure at 312 K in order to achieve their physiological arrangement. The sizes of the proteins considered vary from 2300 to 2700 atoms. Traditionally, the three-dimensional folds of proteins have been perceived as a construct based on elements of secondary structure and fold arrangement. An alternative way to conceptualize and model protein structures, used in our study, is to consider the contacts between atoms, that constitute the amino acid residues, as a network of interactions irrespective of secondary structure and fold type. Hydropathic nature of interactions Here, the concepts presented by Sobolev et al. (1999), and implemented in STING (Higa et al., 2004), were adopted in order to distinguish the nature of interactions. For a protein, based on PDB file assignment, one must take a pair of atoms and, according to the nature of each atom in that pair and on an analysis of the interatomic distance, a class is assigned to each atom. However, other aspects must be taken into account as described by Sobolev et al. (1999). Need of solvation Constituent atoms of the exposed residues at the surface of the proteins tend to show an excessive number of links established with other atoms on the surface of the protein, when the molecule is considered in vacuo and no distance cut-off is used. Aiming at a solution to this problem, a solvation of the protein was done before the analysis of the atomic interactions in order to avoid unrealistic results. The solvation of the protein mimics more realistically the scope where this kind of interaction happens. In order to solvate the molecules analyzed in this study, the package SOLVATE of NAMD (Phillips et al., 2005) was used, using its default parameters. Problem of occlusions Physically, it is unrealistic to consider non-covalent interactions between different atoms of the protein without taking into account the occlusion due to the spatially intervening atoms. In order to address this problem, we developed an algorithm that does not consider unrealistic interactions that could not occur between two atoms having a third (or more) atom(s) occluding one from the other. Calculation of the occlusion between atoms implies the determination of the Euclidian distance and the angle between them. Let T = { Ai; Aj; Ak } | i ≠ j ≠ k be a set of three atoms as shown in Figure 1.
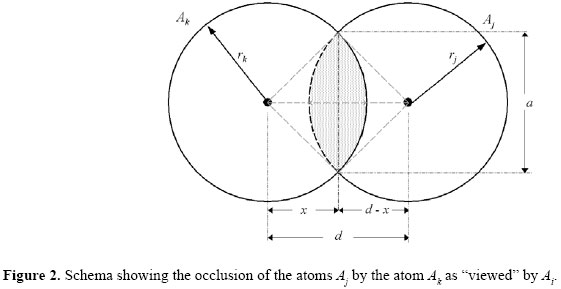
Let Vij be the vector linking (Ai;Aj) and let Vik be the vector linking (Ai;Ak). Let θ be the angle formed by Aj -Ai -Ak. If cos(θ) > 0 and the perpendicular from Ak to Vij is less than the sum of the van der Waals radii of Ak and Aj, then Aj is taken to be occluded from Ai by Ak. In this way, it is important to measure how the energy of interaction between Ai and Aj decreases as the atom Aj becomes obfuscated from Ai by Ak. A reasonable approach would be to take the energy of interaction to be proportional to the remaining exposed projected area from Aj "visible" by Ai. This approach is analogous to a "lunar eclipse", where the earth sheds its shadow over the moon. Geometrically, this rationale can be illustrated as shown in Figure 2.,
In order to better explain this concept, let the projections of two circles of radii rk and rj, and centered at (0; 0) and (d; 0) that intersect both of them in a region shaped like an asymmetric lens. The equations of the two circles are:
In order to find the area of an asymmetric "lens" in which the circles intersect, we may adopt an expression for the circular segment of radius R’ and triangular height d’ where:
Since there are two "lens" at the sphere intersection, the total area of intersection will be found by performing this calculation twice. For instance, the heights of the two segment triangles are
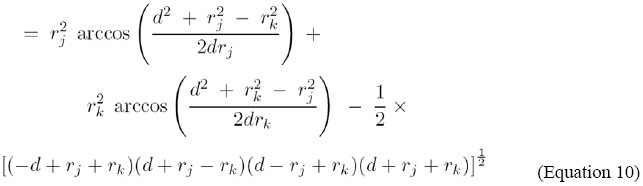
The total area of the "lens" may then be expressed as
or
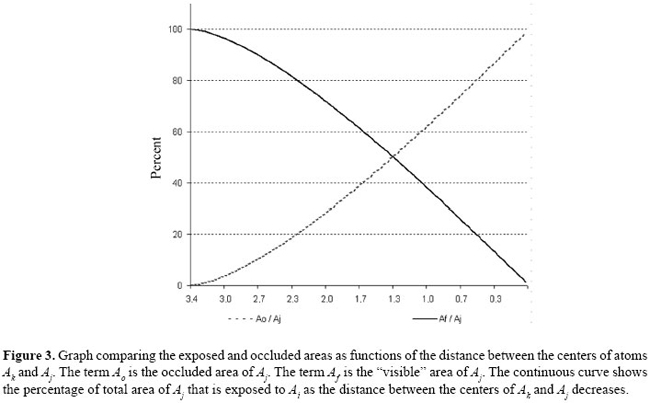
The limiting cases of this expression may be checked varying d = 0 until d = rj + rk. As can be seen in Figure 3, the exposed area of Aj (Af ), decreases quite linearly as Ak intersects the space between Ai and Aj. In the scope of this study, this function will be used as an attenuation factor for the energy of interaction, in order to reproduce the interferences caused by the presence of a third atom in an atomic pair interaction. Construction of the representative graph of protein structure The RGPSs are constructed from the three-dimensional atomic coordinates of the protein structures obtained from the PDB. Each protein in the data set is represented as a graph consisting of a set of vertices and edges. Each atom in the protein structure is represented as a vertex and these vertices are connected by edges based on the energy of non-covalent interaction between them. The energy of interaction between two atoms is given by:
where Eij is the total energy associated with the atomic interaction between the atoms Ai and Aj (i ≠ j) such that Ai and Aj are not part of the same amino acid residue. The total energy associated with each atomic interaction has two components: the energy derived from the Coulomb potential (ECij):
in kcal/mol, where: C - proportionality constant; qi, qj - charge is in electron-charges; εij - apparent dielectric constant of the medium; r(ij) - distance in Angstroms; and the energy associated with the Lennard-Jones potential (ELJij ):
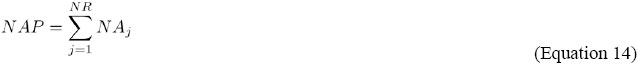
where: εij - apparent dielectric constant of the medium between i and j; n - large coefficient (usually 12); m - low coefficient (usually 6); reqm(ij) - parameter distance for an interaction between i and j; r(ij) - present distance between i and j; as described in the AMBER98 (Morris et al., 1998) potential. Initially, let a protein P be formed by a sequence of NR residues {R1;R2;R3; … ;RNR}. Let a residue R be formed by a sequence of NA atoms {A1;A2;A3; … ;ANA}. The total number of atoms in a protein NAP is calculated as:
A protein P may be viewed as formed by a set of NAP atoms {A1;A2;A3; … ;ANAP}. The following procedure is used in order to identify the pairs of atoms (Ai, Aj) that establish an interaction:
where Af is the exposed area of Aj. In this procedure no arbitrary cut-off for the distance between the pair (Ai, Aj) is needed, since the most relevant criterion for establishing an interaction is the presence or not of a third atom Ak that could hide, totally or partially, Aj from Ai. Therefore, if Aj is "visible" by Ai there is an interaction and the energy of interaction is calculated. For practical reasons, we limited our calculations to a sphere of influence with radius of 10 Å in order to avoid an unnecessary amount of computation. On the one hand, the Lennard-Jones potential is usually calculated from this limit and below. On the other hand, we studied other values beyond this limit but all pairwise interactions, where the distance between the atoms was greater than 9 Å, were occluded. In this study, the dielectric constant for calculations focusing on the atoms inside the proteins was fixed at 4. Analysis of representative graph of protein structures The networks are analyzed for the distribution of nodes with k links. For each RGPS, the number of nodes N(k) with k edges (links) is evaluated. The value N(k) for all proteins in the data set is taken, and then N(k) versus k is plotted. In order to calculate some properties of the RGPS, they are represented as an adjacency matrix AE, where:
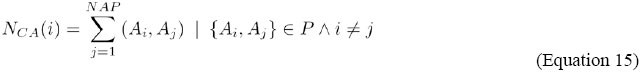
The adjacency matrix AE is then analyzed using standard graph techniques to identify distinct clusters and the cluster-forming nodes (atoms) in the RGPS. The largest cluster is then identified, and its size is determined for all the RGPSs. The normalized value of the largest cluster size (with respect to the total number of residues in the protein) is plotted for all the proteins in the data set. Specifically, the high contact number atoms (NAP > 10), and residues, will be referred as "hubs". Edge distribution profile of atoms and residues of amino acids For a given atom Ai, the total number of contacts established by it, may be defined as:
For a given residue Rm, the total number of contacts for this residue NCR(m) is calculated as:
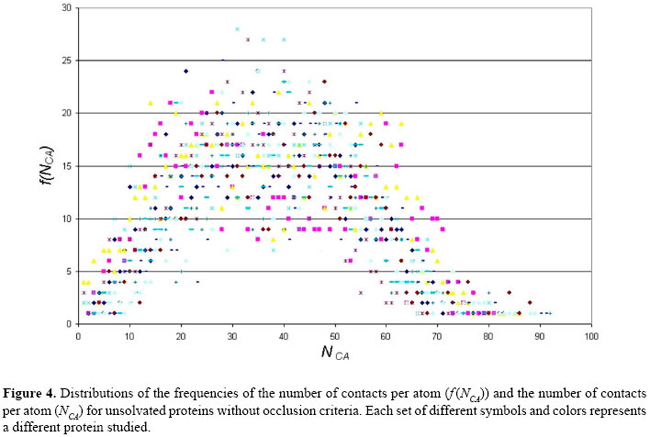
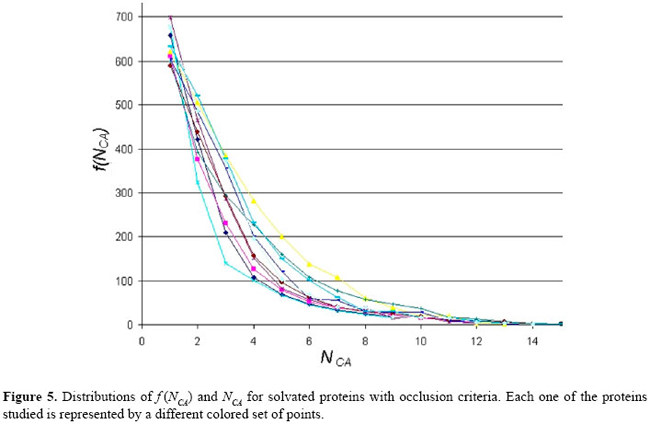
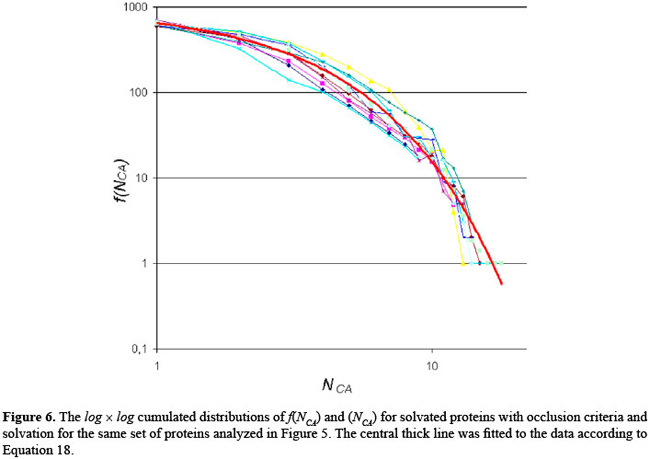
where P is the protein studied, and: i ≠ j ^ Ai ∈ Rm ^ Aj RESULTS Aiming at the evaluation of the structural features shown by all 12 proteins present in our data base, the interactions among the atoms from each protein were analyzed as explained in the previous section. As a result, some graphs and tables were constructed. Firstly, these interactions were analyzed under the condition where the proteins are not solvated and using a distance cut-off value of 10 Å. For this scenario, the number of interactions per atom (NCA) and the frequency of these interaction values (f (NCA)) were plotted, for each of the 12 proteins in our data base, as shown in Figure 4. As can be seen in Figure 4, these results reveal that the pattern of link distribution of f (NCA) values tends toward a bell-shaped Poisson distribution, similar to preliminary results presented by Greene and Higman (2003). These results also show that, for all 12 proteins, the mode number of links for a given node is approximately 35. However, when the interactions were analyzed taking into account the solvation of the proteins and using the occlusion criteria, the plotting of NCA and f (NCA) gives the distribution shown in Figure 5. In these distributions, there are a small number of nodes with many links and a large number of nodes with only a small number of links. This distribution pattern is consistent with scale-free behavior and initially suggested that, under these conditions, the interaction network may be scale-free. This second approach shows a more regular distribution without any arbitrary intervention. In order to better analyze these data, the cumulative distribution for each protein was plotted using a log × log scale, as shown in Figure 6. A central tendency line fit of data on a log × log plot is a standard way in which to measure the distribution by calculating the slope. As can be seen in Figure 6, all distributions start to show distributions that coarsely follow an exponential distribution:
For instance, for all the 12 plotted distributions, the tendency curve can be expressed as
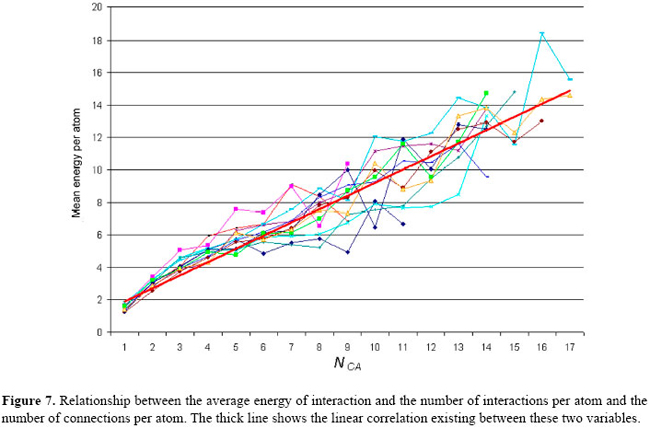
with R2 = 0.98. In spite of the tendency of link distributions towards an exponential distribution, which indicates that the observed networks show a small-world distribution, a more representative analysis of the networks may be conducted when the energies of links are taken into account. The most relevant aspect of this approach is that a weight may be given to each link of the networks studied. In this way, the associated weights show a physical significance expressed as the energy of non-covalent interaction between the atoms. The plot of the mean energy per atom (EMA) and the number of links per atom (NCA) is presented in Figure 7. As can be observed in Figure 7, there is a strong correlation between the number and the energy of non-covalent interactions related to each atom of the protein. Indeed, the energy associated with each non-covalent interaction can be viewed as the edge’s weight when modeling the structure of the proteins as networks. Furthermore, modeling the protein structures could be based on a weighted network model.
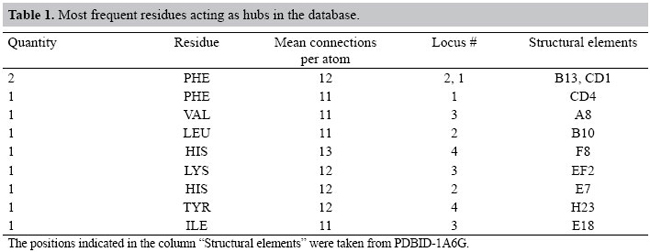
However, other different aspects must be analyzed, especially the most connected atoms (and the related amino acid residues) that play the role of "hubs" in the network models of the proteins studied. In Figure 5, the tail of the graph indicates that the atoms with NCA ≥ 10 will be elected as the hubs of the networks studied. Selecting these atoms from the database, it is possible to identify the most connected amino acid residues present in the proteins studied. The residues in Table 1 were found to be the most frequent residues acting as hubs in our database. The mean number of connections per atom for the hub residues is close to 12 as seen in Table 1. This value is very similar to that shown by the packing of identical spheres, found also in crystals of small organic compounds and proteins (Richards and Lim, 1994). These values indicate that atoms inside proteins share an environment of high atomic density.
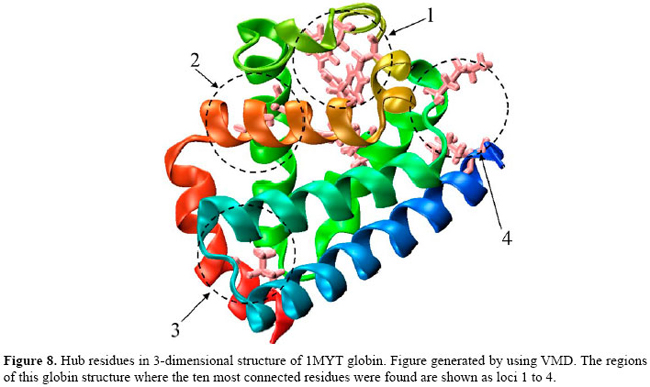
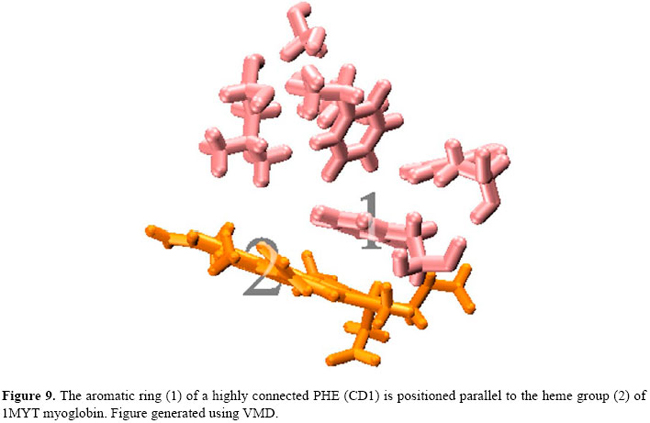
Interestingly, six of those ten most connected residues shown in Table 1 have rings in their side chains. As an example, Figure 8 shows where these most connected residues are in the 3-dimensional structure of the 1MYT globin. In this particular case, the ten most connected residues were found at loci 1, 2, 3, and 4 in Figure 8. At locus 1, three PHE (B13, CD1, CD4) residues and a LEU (B9) tie together the helices B, C and D and the heme group (not shown in Figure 8). At locus 2, a HIS (E5) residue connects the helices B and E. At locus 3, a VAL (H9) residue connects the helices A and H, and at locus 4, a HIS (F9) and a TYR (H21) residue connect the helices F and H. These residues are found to be the most conserved in the structural alignment studies of globins (Lesk and Chothia, 1980; Dickerson and Geis, 1983; Bashford et al., 1987; Kapp et al., 1995; Ptitsyn and Ting, 1999; Süel et al., 2002). Another interesting point is that one of the most connected PHE (CD1) residues keeps its side chain parallel to the heme group of the myoglobins studied. For instance, Figure 9 gives a more detailed view of locus 1, where the aromatic ring (1) of the PHE (CD1) residue is shown positioned parallel to the heme group (2) of the 1MYT myoglobin. The PHE in the CD1 position is one of the most conserved residues in globins. This fact is described in the literature, having a strong relation to the anchorage and binding of the heme group (Dickerson and Geis, 1983; Hargrove et al., 1994). It shares with the proximal HIS (F8) an absolute conservation in all globins known to date (Kapp et al., 1995).
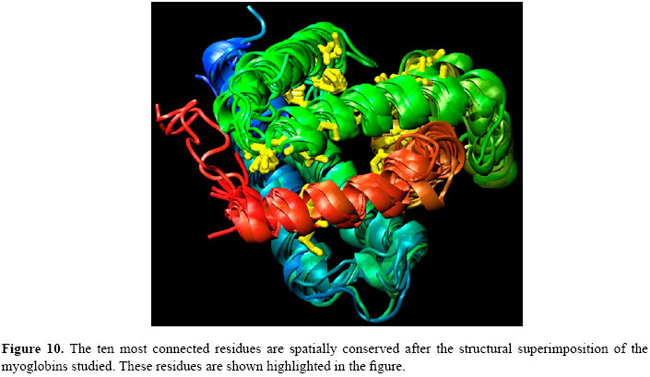
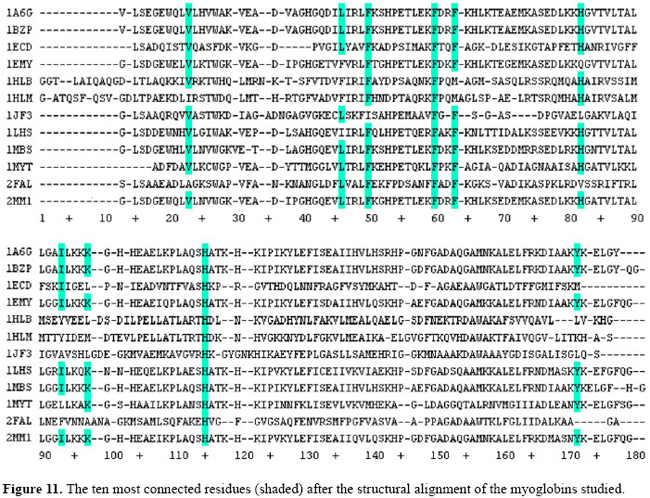
In order to better locate these "hubs" in these conserved loci, a structural alignment of all proteins in the dataset was performed as shown in Figure 10. Figure 10 also shows where the "hubs" are spatially located after the spatial alignment, and Figure 11 indicates where they can be found when this multiple spatial alignment is presented in a linear way. These results lead to conclusion that, in these structures, the "hubs" are not only conserved in their positions, but that some properties shared by the residues are conserved in each spatial locus. For example, at loci 50 and 60, in Figure 11, the PHE residues may be replaced by an ILE residue or a MET residue, and all these three different residues show three covalent interactions of distance from the Cα to the tip of the side chain and atoms able to establish high number of contacts. A detailed analysis of conserved patterns of these structures extrapolates the scope of this study and will be the subject of future researchs. The analysis of these "hubs" must provide interesting insights about the conserved attributes of the structures of the myoglobins under study.
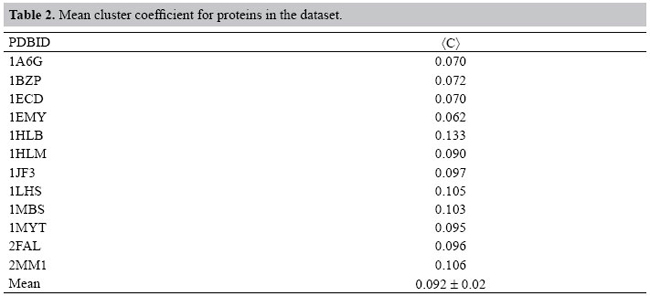
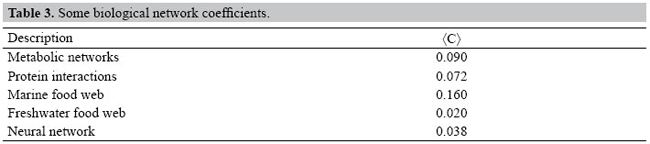
However, all these findings suggest that the analysis of the atomic interactions that form the structure of the proteins, based on the previous solvation of proteins and original occlusion method presented in this study, allows one to identify the underlying complex network pattern of proteins in an unsupervised way and without an arbitrary cut-off parameter. At the same, the identified links of the network have weights with physical significance expressed in terms of non-covalent interaction energy, which is another virtue of the approach presented. DISCUSSION The thermodynamic stability of the proteins should emerge as a property of the robustness of the inherent atomic network. The approach adopted here gives the opportunity to associate a more realistic weight with the edges of the model network. An exhaustive analysis was necessary in order to identify the energies of interaction of all atomic pairs that form the structure of the proteins analyzed. However, aiming at validating the methodology presented here, a discussion of the results is necessary. Initially, the protein structures were considered as atomic clusters taking into account the aspects of occluded interactions. These structures were then analyzed and the subjacent networks were characterized. Our first goal was to determine whether the pattern of weighted links keeps resembling a small-world or random networks according to the results in the literature (Dokholyan et al., 2002; Greene and Higman, 2003). The initial rounds of experiments modeling the proteins as networks used data of atoms directly from PDB files. These raw data were then used in drawing the networks. However, the initial results showed some unreal characteristics when no cut-off value was used to limit the distance between the atoms in order to evaluate the interactions among them. When an arbitrary cut-off value for the distance is used, the numbers of edges linked to hubs tend to increase or decrease. This raises a question: what would be the most appropriate cut-off value to be applied in the structural studies of proteins? Different strategies have been used in order to deal with this problem (Greene and Higman, 2003; Amitai et al., 2004; Bagler and Sinha, 2005). Constituent atoms of the exposed residues at the surface of the proteins tend to show an excessive number of interactions established with other atoms on the surface of the protein, when the molecule is considered in vacuo and no distance cut-off is used. Indeed, residues exposed to the solvent tend to show an excessive number of links established with other atoms on the surface of the protein when no cut-off is used. Aiming at a solution to this problem, solvation of the protein was performed. The results, after solvation of the protein, showed a drastic decrease in the number of links among the atoms without any kind of intervention even in the absence of any cut-off value for interatomic distances. Consequently, the behavior of the resulting network becomes acceptable, showing hubs with no excessive number of links. The mean clustering coefficient for all proteins in the set studied was <C> = 0.089 and standard deviation σ = 0.020. Table 2 shows the clustering coefficients for the proteins studied. When these values are compared to values reported by other authors (Newman, 2003), it is possible to conclude that the range of values is similar to other biological networks (Table 3).
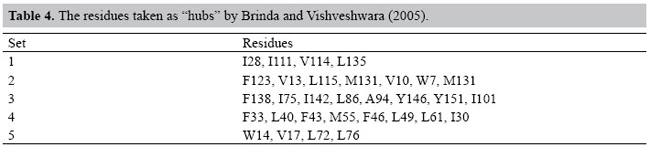
This comparison highlights the complex pattern of protein structures. Data in Table 3 show that the energy interactions inside the protein establish some atomic clusters in the same way as in other similar biological structures studied by different authors. These results give evidence of the dependence of protein structures on the hubs of energy of interaction between atoms of the protein. In order to deal with this kind of analysis, a set of hubs was elected for each protein in study. In this context, all the nodes that show 4 or more links are said to be "hubs". Figure 4 shows the distribution of f (NCA) x NCA for the set of proteins when the contacts among the atoms of each protein are analyzed employing a sphere of influence with a radius of 10 Å around each atom, and no occlusion nor solvation is used. As can be viewed, these data tend to follow a Poison distribution as an indication of a random distribution. However, in Figure 5, the same set of proteins is analyzed using the same sphere of influence of 10 Å but applying the occlusion criteria for solvated proteins; all distributions in these conditions seem to coarsely follow an exponential distribution. In spite of the fact that an extensive discussion of the present results is beyond the scope of this study, we may briefly compare them with the results presented by Brinda and Vishveshwara (2005). In that study, the authors adopted an arbitrary cut-off of 4.5 Å, in order to limit the distance between the atoms, and also restricted their attention to the hydrophobic non-covalent interactions aiming at the analysis of the structural features of the proteins. They identified a set of "clusters" for the globin PDB ID 4MBN, as presented in Table 4.
Comparing the residues presented in Table 4 to those highlighted in Figure 11 for PDB ID 1A6G, the results are quite similar, despite the different approaches adopted in both researchs in order to conduct their analysis: on the one hand, an arbitrary cut-off value of 4.5 Å and, on the other hand, the occlusion criteria. Almost all of the hydrophobic or aromatic residues in 1A6G taken as "hubs" (namely, V10, F33, F43, F46, I75, Y146) were found to be part of Brinda and Vishveshwara’s highly connected clusters, except the residue L29. However, this leucine is present between I28 and I30 in the primary structure of 4MBN, which are present in clusters 1 and 5, respectively. This fact suggests that all these residues may be sharing the same structural neighborhood. Other "hub" residues in 1A6G, H64 and H93 were not identified by Brinda and Vishveshwara (2005), since they are not classified as hydrophobic. However, the residues H64 and H93 are respectively the distal and proximal histidines, which are essential for the maintenance of globin function. As they are buried in the ligand pocket, they are expected to have a high number of contacts. These findings reinforce our conviction that the approach proposed in this paper is robust enough to be adopted as a general procedure, cut-off free, in order to analyze protein structures. The identification of the "hubs" of these structures allowed us to map the loci where they occur in the 3-dimensional structure of the proteins studied. Interestingly, these identified loci prompt the deduction of some relevant structural characteristics of these proteins and about the amino acid residues that are present in these loci. It is well known that the biological synthesis of a myoglobin involves the conversion of an apomyoglobin to a holomyoglobin, a process that involves the binding of heme, the prosthetic group of all globins. In the context of this study, it is worth mentioning that none of the heme group atoms were described as an energy "hub" within the network of the globin, minimizing the possible role of heme in the folding of this protein, although it is known to contribute to the stability of these proteins. As proposed by Watts and Strogatz (1998), connection topology of some biological, social, and technological networks is neither completely regular nor completely random. These networks, that are somehow in between regular and random networks, have been called "small worlds" analogous to the "small world" phenomenon empirically observed in social systems. The algorithms implemented in our study lead to a more refined description of a protein structure as a complex network of energy interactions between all atoms of the protein. The most relevant contribution of the new approach presented in this study is the identification of pairwise interactions among atoms inside a protein, taking into account the steric interference of other atoms. The approach presented takes into account also the total energy of non-covalent interaction and pruning out those interactions where implicit energy is above the "kT" limit, and reveals the atomic contacts that fulfill the physical predicates that assure their existence. At present, only a merely geometric criterion has been adopted in the analysis of protein structure (Vendruscolo et al., 2002; Greene and Higman, 2003; Amitai et al., 2004; Bagler and Sinha, 2005; Brinda and Vishveshwara, 2005), where arbitrary distance cut-offs are elected that lack physical meaning. The network behavior described in this study may be a characteristic of globin structures; whether it may be extended to all globular proteins is a matter that deserves further studies. REFERENCES Amitai G, Shemesh A, Sitbon E, Shklar M, et al. (2004). Network analysis of protein structures identifies functional residues. J. Mol. Biol. 344: 1135-1146. Atilgan AR, Akan P and Baysal C (2004). Small-world communication of residues and significance for protein dynamics. Biophys. J. 86: 85-91. Bagler G and Sinha S (2005). Network properties of protein structures. Physica A 346: 27-33. Barabasi AL (2002). Linked: the new science of networks. 1st edn. Persues Publishing, Cambridge. Bashford D, Chothia C and Lesk AM (1987). Determinants of a protein fold. Unique features of the globin amino acid sequences. J. Mol. Biol. 196: 199-216. Berman HM, Westbrook J, Feng Z, Gilliland G, et al. (2000). The protein data bank. Nucleic Acids Res. 28: 235-242. Bollobás B, Riordan O, Spencer J and Tusnády G (2001). The degree sequence of a scale-free random graph process. Random Struct. Algorithms 18: 279-290. Brinda KV and Vishveshwara S (2005). A network representation of protein structures: implications for protein stability. Biophys. J. 89: 4159-4170. Dickerson RE and Geis I (1983). Hemoglobin: structure, function, evolution, and pathology. Benjamin/Cummings, Menlo Park. Dokholyan NV, Li L, Ding F and Shakhnovich EI (2002). Topological determinants of protein folding. Proc. Natl. Acad. Sci. USA 99: 8637-8641. Fersht AR and Daggett V (2002). Protein folding and unfolding at atomic resolution. Cell 108: 573-582. Greene LH and Higman VA (2003). Uncovering network systems within protein structures. J. Mol. Biol. 334: 781-791. Guimerá R and Nunes Amaral LA (2005). Functional cartography of complex metabolic networks. Nature 433: 895-900. Hargrove MS, Krzywda S, Wilkinson AJ, Dou Y, et al. (1994). Stability of myoglobin: a model for the folding of heme proteins. Biochemistry 33: 11767-11775. Higa RH, Togawa RC, Montagner AJ, Palandrani JC, et al. (2004). Sting millennium suite: integrated software for extensive analyses of 3D structures of proteins and their complexes. BMC Bioinformatics 5: 107. Holme P, Huss M and Jeong H (2003). Subnetwork hierarchies of biochemical pathways. Bioinformatics 19: 532-538. Kapp OH, Moens L, Vanfleteren J, Trotman CN, et al. (1995). Alignment of 700 globin sequences: extent of amino acid substitution and its correlation with variation in volume. Protein Sci. 4: 2179-2190. Lesk AM and Chothia C (1980). How different amino acid sequences determine similar protein structures: the structure and evolutionary dynamics of the globins. J. Mol. Biol. 136: 225-270. Morris GM, Goodsell DS, Halliday RS, Huey R, et al. (1998). Automated docking using a Lamarckian genetic algorithm and empirical binding free energy function. J. Comput. Chem. 19: 1639-1662. Newman MEJ (2003). The structure and function of complex networks. SIAM Rev. 45: 167-256. Onuchic JN and Wolynes PG (2004). Theory of protein folding. Curr. Opin. Struct. Biol. 14: 70-75. Phillips JC, Braun R, Wang W, Gumbart J, et al. (2005). Scalable molecular dynamics with NAMD. J. Comput. Chem. 26: 1781-1802. Ptitsyn OB and Ting KL (1999). Non-functional conserved residues in globins and their possible role as a folding nucleus. J. Mol. Biol. 291: 671-682. Richards FM and Lim WA (1994). An analysis of packing in the protein folding problem. Q. Rev. Biophys. 26: 432-598. Sobolev V, Sorokine A, Prilusky J, Abola EE, et al. (1999). Automated analysis of interatomic contacts in proteins. Bioinformatics 15: 327-332. Süel GM, Lockless SW, Wall MA and Ranganathan R (2002). Evolutionarily conserved networks of residues mediate allosteric communication in proteins. Nat. Structural Biol. 10: 59-69. Vendruscolo M, Dokholyan NV, Paci E and Karplus M (2002). Small-world view of the amino acids that play a key role in protein folding. Phys. Rev. E. Stat. Nonlin. Soft. Matter Phys. 65: 061910. Watts DJ and Strogatz SH (1998). Collective dynamics of ‘small-world’ networks. Nature 393: 440-442. |
|||||||||||||


 Rm ^ {Ai;Aj} ∈ P.