![]()
![]()
![]()
![]()
![]()
![]()
![]()
![]()
![]()
![]()
![]()
|
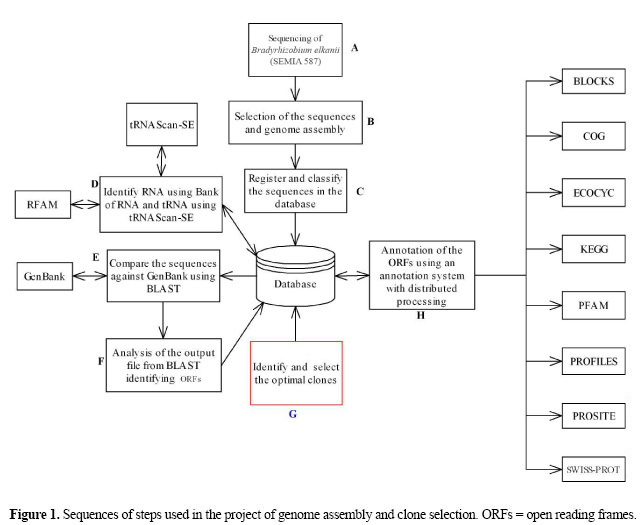
Optimal clone identifier for genomic shotgun libraries: "OC Identifier tool" M.E. Cantão1,2, J.E. Ferreira1 and E.G.M. Lemos2 Genet. Mol. Res. 6 (4): 743-755 (2007) Abstract. In DNA microarray experiments, the gene fragments that are spotted on the slides are usually obtained by the synthesis of specific oligonucleotides that are able to amplify genes through PCR. Shotgun library sequences are an alternative to synthesis of primers for the study of each gene in the genome. The possibility of putting thousands of gene sequences into a single slide allows the use of shotgun clones in order to proceed with microarray analysis without a completely sequenced genome. We developed an OC Identifier tool (optimal clone identifier for genomic shotgun libraries) for the identification of unique genes in shotgun libraries based on a partially sequenced genome; this allows simultaneous use of clones in projects such as transcriptome and phylogeny studies, using comparative genomic hybridization and genome assembly. The OC Identifier tool allows comparative genome analysis, biological databases, query language in relational databases, and provides bioinformatics tools to identify clones that contain unique genes as alternatives to primer synthesis. The OC Identifier allows analysis of clones during the sequencing phase, making it possible to select genes of interest for construction of a DNA microarray. Key words: Optimal clones, Bioinformatics tool, Comparative genomic hybridization, Gene expression, DNA microarray, Genomic shotgun libraries INTRODUCTION To adequately develop microarray technology, it is important to have a definition and specific genes in the microarray. Usually, the genetic fragments used in DNA microarray experiments are obtained from completely sequenced genomes (Koide et al., 2004). The gene fragment placed on the slide is a product of the PCR reaction with the specific primer of the desired genes. A DNA microarray analysis was made of two strains of the Xylella fastidiosa bacteria, one phytopathogenic and the other not, with 2692 sequences ranging in size from 200 to 1000 bp, created as PCR products through the design and synthesis of primers (Koide et al., 2004). The primers were designed and synthesized based on the completely sequenced and annotated genome of X. fastidiosa, lineage 9a5c (http://aeg.lbi.ic.unicamp.br/xf). Synthesizing primers is very expensive, and the complete sequencing of an organism’s genome requires considerable financial investment. The genome was completely sequenced, 94.5% (2692) of the 2848 codifying sequences were used to create the DNA microarray (Koide et al., 2004). In this approach towards the construction of a DNA microarray, it is necessary to obtain a pair of specific primers for each gene, resulting in high costs. Shotgun library sequences are an alternative to synthesized primers for the study of all the genes in the genome. With this approach (shotgun clones), there is the advantage of proceeding with microarray analysis without the need for a sequenced genome, which is useful for the analysis of gene expression. We used a microarray containing random DNA sequences, obtained from shotgun libraries. The RNAs transcribed on the cells under different experimental conditions were extracted and hybridized against the sequences from the clones of the DNA microarray. Throughout this process, only the clones containing differentiated expression in each experiment were sequenced. This methodology was used with Erwinia chrysanthemi 3937 (Okinaka et al., 2002), with the aim of identifying regulatory growth genes in host plants, which were compared in the growth medium through a microarray containing roughly 5000 random clones, each with an approximate size of 3 kb. After hybridization, 89 clones were selected by statistical analysis. These clones were sequenced and the data analyzed using the BLAST program (Altschul et al., 1997), using BLASTX and BLASTN for the query. Many clones were completely sequenced by sequential primer walking; the selected clones contained from two to four open reading frames (ORFs). To determine which were the regulatory ORFs, 59 regions of interest in the clones were amplified using PCR and a new DNA microarray was created for analysis. This new DNA microarray contained individual ORFs, with sizes ranging from 0.4 to 1.6 kb. Since clones can contain various ORFs, the microarray is inappropriate for analysis by CGH. If the DNA microarray is to be used for new analyses of transcriptomes, all the sequencing steps and new hybridizations will be necessary, due to the fact that it is not possible to know which genes make up the microarray. We developed an alternative to synthesized primers and sequencing of the hybridized clones, by developing a bioinformatics tool that allows us to determine clones with unique genes (optimal clones), based on shotgun sequencing results. These clones are an alternative to primer synthesis to isolate each gene in the genome, allowing production of a DNA microarray in which it is known beforehand which genes are present on the slide. This avoids repeated genes in the microarray. Based on a partially sequenced genome, the optimal clone (OC) Identifier tool, along with comparative analysis of genomes and annotation, identifies clones containing unique genes to set up the microarray, with the advantage that one can use the same slide to develop an analysis of gene expression and phylogeny by CGH. The OC Identifier tool has been used to select clones in a genomic library of Bradyrhizobium elkanii SEMIA 587. These sequenced clones were used for partial genome assembly of B. elkanii and to produce a microarray with known genes. This partial microarray was used to determine gene expression of B. elkanii during symbiosis with soybean (Glycine max) plants; it is involved in the nodulation of plants and biological fixation of nitrogen (Prado AL, personal communication, 2004). Moreover, the same microarray was used in CGH comparative studies between B. japonicum, B. elkanii and Rhizobium etli (Dall’Acqua WR, personal communication, 2004). The use of the OC Identifier tool allowed concomitant analysis of the same shotgun genome sequences in three different biological projects. The sequences used in the projects gave successful results, allowing genes of interest to be selected to make up a DNA microarray; these genes were identified in a partial genome sequence, avoiding the additional costs of sequencing. MATERIAL AND METHODS The OC Identifier tool uses the programming language Perll (www.perl.org) and the relational database system MySQL (www.mysql.org). It uses the bioinformatics tools: ORF Finder (Rombel et al., 2002) and Glimmer (Delcher et al., 1999), software used for gene prediction; Phred (Ewing et al., 1998), software used to assign a quality value to each base (phred quality); Phrap (http://bozeman.mbt.washington.edu/phrap.docs/phrap.html), a program for assembling shotgun DNA sequence data; Consed (Gordon et al., 1998) software for viewing the sequence assemblies; tRNAScan-SE (Lowe and Eddy, 1997) software for detection of tRNA genes in genomic sequence, and the BLAST tool (Altschul et al., 1997) for sequence alignment and comparing biological sequence information. The main steps of the OC Identifier are described in Figure 1. The first step is the sequencing of the genome, which has as its ultimate aim analysis of gene expression, phylogeny by CGH and assembly of the genome simultaneously. The OC Identifier is split into three phases:
The following is a brief description of the activities and their respective modules:
 The annotation of the identified ORFs can be conducted after hybridization and analysis of the images from the microarray, selecting only those clones that exhibit good results for annotation. This annotation after hybridization aims to analyze only those clones that show interesting results, avoiding the waste of time associated with analyzing thousands of clones on the slide. The distributed annotation of these ORFs is compared to the following public biological databases:
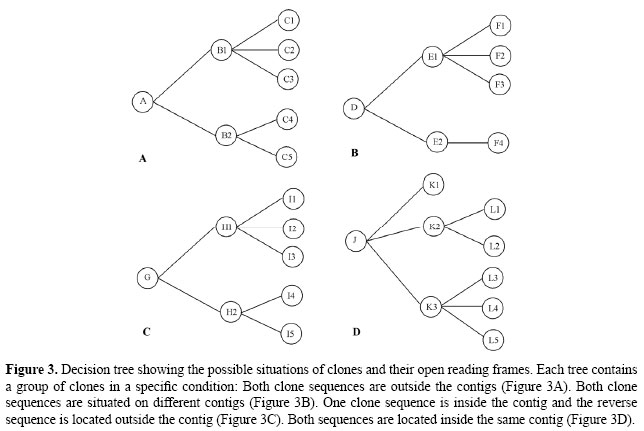
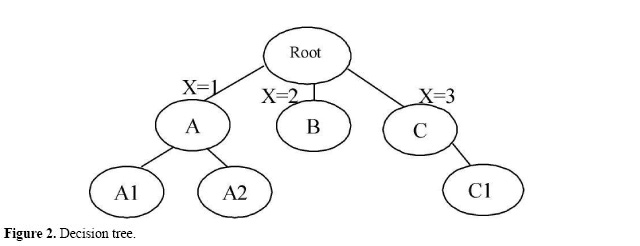
Identifying optimal clones In the searches to identify clones containing unique genes, only those that meet the parameters of the searches will be selected. Analysis for a few ORFs and clones can be conducted by hand, but when the number of clones, contigs and ORFs increases, manual analysis becomes unfeasible. One way of automating the clone analysis process is by organizing them into classes. Each class can be composed of a group of clones that share common traits; later, rules can be made for the analysis of each class. Throughout this process, specific rules can be created for the analysis of each group of clones. The algorithm for the selection of optimal clones executes the analysis of all the clones belonging to the classes in an automated way, selecting the best clone for each situation and selecting only those that satisfy the parameters chosen for the search. One example of classification and rules used in the analysis can be seen in Figure 3, where the sequence clones after genome assembly were divided into two classes: (C) sequences of clones inside the contigs, and (S) sequences of clones outside the contigs. These rules are illustrated in the decision tree shown below.
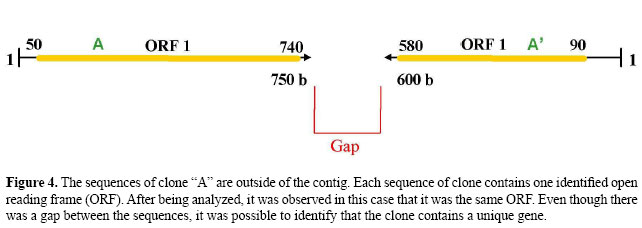
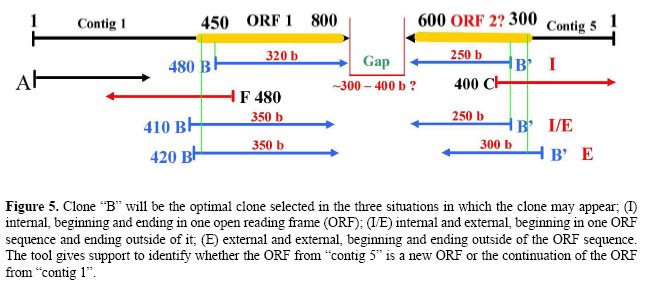
One example of the analysis conducted using the OC Identifier algorithm is described below and is illustrated in Figures 3A and 4, 3B and 5, 3C and 6, and 3D and 7: • Clones belonging to class (S), both sequences outside the contig (Figure 3A). A → Both sequences of clones generated by forward and reverse primers are located outside the contig. B1 → Both sequences of clones contain one or more identified ORFs. C1 → If each sequence of the clone contains one identified ORF and the ORFs are the same, the clone contains a unique gene. C2 → If each sequence of clones contains one identified ORF and the ORFs are different, the clone has two genes. C3 → One sequence of the clone generated by the primer contains one identified ORF, and another sequence of the clone contains two identified ORFs. If, among the three identified ORFs, two are the same, the clone has two genes. B2 → Only one sequence of the clone generated by forward or by reverse primers contains identified ORFs. C4 → One sequence of clone contains one identified ORF. If, after additional analysis of another sequence of the clone no ORF is found, the clone contains a unique gene. C5 → One sequence of clone contains two identified ORFs. If, after additional analysis of another sequence of the clone no ORF is found, the clone has two genes.
• Clones belonging to class (C), both sequences in different contigs (Figure 3B). D → Both sequences of clones generated by forward and reverse primers are found in different contigs. E1 → The sequences of clones contain identified ORFs in both contigs. F1 → If each sequence of the clone inside the contig contains one identified ORF and the ORFs are the same, the clone contains a unique gene. F2 → If each sequence of the clone inside the contig contains one identified ORF and the ORFs are different, the clone has two genes. F3 → One clone sequence inside the contig contains one identified ORF and another clone sequence inside of another contig contains two identified ORFs. If, among the three ORFs identified, two are the same, the clone has two genes. E2 → Only one sequence of contig contains identified ORFs. F4 → One identified ORF in the sequence of the clone inside the contig. Hence, this clone contains a unique gene, if, after additional analysis in another sequence of contig, no ORF is found.
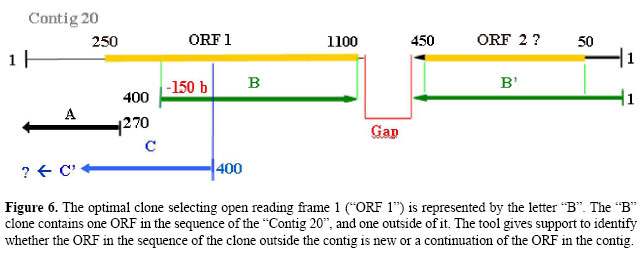
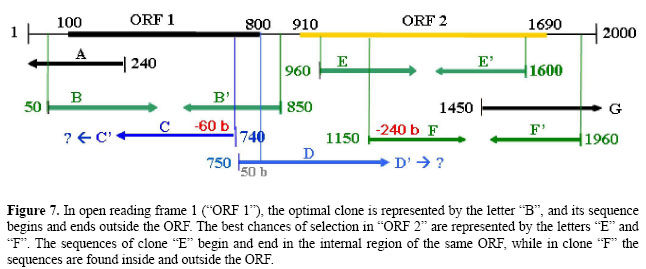
• Clones belonging to classes (C) and (S), one sequence within the contig, and another sequence outside it. Figure 3C. G → The sequences generated by forward and reverse primers can be found in the contig and outside of it. H1 → The clone contains identified ORFs in the sequence inside the contig and outside of it. I1 → One identified ORF in the sequence of clone inside the contig and one identified ORF in the sequence of clone outside it. If the identified ORFs are the same, the clones contain a unique gene. I2 → One identified ORF in the sequence of clone inside the contig and one identified ORF in the sequence of clone outside it. If the identified ORFs are different, the clone has two genes. I3 → One sequence of the clone located inside or outside the contig contains one identified ORF, and another sequence of the clone contains two identified ORFs. If, among the three ORFs identified, two are the same, the clone has two genes. H2 → The sequence of the clone located in the contig or outside of it contains identified ORFs. I4 → One identified ORF in the sequence of contig. If, after additional analysis of the sequence of the clone outside the contig no ORF is found, the clones contain a unique gene. I5 → One identified ORF in the sequence of clone outside the contig. If, after additional analysis in the sequence of contig no ORF is found, the clone contains a unique gene. • Clones belonging to class (C), both sequences internal in the same contig. Figure 3(D). J → The sequences generated by forward and reverse primers are found in the same contig. K1 → The sequence of the clone begins and ends in the internal region of the same ORF, hence, the clone contains a unique gene. K2 → One sequence of the clone generated by a primer begins in the internal region of an ORF.
L1 → If another clone sequence generated by another primer begins in the region with no identified ORF, the clone contains a unique gene. L2 → If another sequence of the clone begins in the region with one identified ORF, the clone has two genes. K3 → The sequence of the clone begins and ends outside of an identified ORF. L3 → If the beginning sequences generated by the primers contain only one identified ORF, the clone contains a unique gene. L4 → If the beginning sequences generated by the primers contain two identified ORFs, the clone has two genes. L5 → If the beginning sequences generated by the primers contain more than two identified ORFs, the clone has more than two genes. For all analyses, the ORFs and the clones are evaluated using the parameters chosen for the searches. The algorithm checks each clone for results that fit into the existing possibilities, making this process automated, and that is repeated for each clone in the project. The algorithm was developed based on the classical computing solution, in which the rules were pre-established in a decision tree. Herewith, all the alternatives are pre-defined and are all tested automatically, according to the parameters of the situations illustrated in Figures 4, 5, 6, and 7.
RESULTS AND DISCUSSION Based on the sequencing of shotgun libraries of the genomic DNA of the bacteria B. elkanii SEMIA 587, we obtained 16,016 reads with selected fragment sizes ranging from 0.6 to 1.6 kb. Among these, 4895 reads were extracted from the assembly because they presented some problems, such as: sequences of less than 150 bp with an average quality ≥20, when analyzed by the software phred; vector sequences, and discrepancies in assembly. Consequently, we used 11,121 reads in the assembly of the partial genome, of which 10,176 had a region that was greater than 400 bases with an average phred quality ≥20, resulting in a percentage above 91%. The assembly produced 2522 contigs, composed of 8043 reads, which corresponds to approximately 2,470,000 sequenced nucleotides, and 3078 singlets, corresponding to approximately 1,460,000 sequenced nucleotides. With the sum of the nucleotides from all contigs and singlets, corresponding to the sequence regions with an average phred quality ≥20, we obtained approximately 3,930,000 sequenced nucleotides, which presented an average GC content of 62.9%. In comparison, the genome of the bacterium B. japonicum USDA 110 (Kaneko et al., 2002), a bacterium of the same genus as the one used in this study, contains 9,105,828 nucleotides contained within a circular chromosome, which present an average GC content of 64.1%. Therefore, it can be estimated that approximately 43% of the genome of B. elkanii was sequenced. Using the sequences from the reads and contigs when compared and analyzed against the genomic database, 8317 genes were obtained (Kaneko et al., 2002). Therefore, the approximately 3250 genes identified in B. elkanii correspond to around 39% of the genes identified in B. japonicum. The OC Identifier selected clones containing unique ORFs and clones containing different ORFs for each sequence of the clones. These selected clones were used to create a DNA microarray. The ORFs were identified by comparison of the sequences with Genbank using the BLAST tool and the gene prediction software Glimmer to identify exclusive genes in the B. elkanii genome. All pre-selected ORFs were compared again to eight other banks: BLOCKS, COG, ECOCYC, KEGG, PFAM, PROFILES, SWISS-PROT, and PROSITE. The aim of this comparison was to validate the selected ORFs and to identify the potential genes in each clone. This annotation can be conducted after hybridization and after analyzing the images in the microarray, analyzing only the clones that hybridized in order to validate the experiment. This approach to the selection of clones that contain genes was used to create a DNA microarray with 2654 clones used in transcriptome analysis of the genes involved in the metabolism of B. elkanii, cultured in a lab and found symbiotically associated with soybean plants (Glycine max) and presumably involved in the biological fixation of nitrogen (Prado AL, personal communication, 2004). A brief summary of the results obtained in the study is described below. The comparison of the level of expression between the two symbiotic forms of B. elkanii SEMIA 587 was analyzed using the statistical tool SAM (significance analysis of microarrays) (Tusher et al., 2001). After hybridization analysis, 129 genes were obtained with significant expression (63 for bacterioids and 66 for the bacterial form).
The same microarray was also used in the comparison between B. japonicum, B. elkanii and R. etli by CGH (Dall’Acqua WR, personal communication, 2004). A brief summary of the results is described below. After hybridization analysis, 606 genes were found to share DNA similarities among the three species. Of the 606 genes that share DNA similarities with the three species, 252 (or 41.6%) presented similarities only between B. japonicum and B. elkanii, and none presented similarity with R. etli; 66 genes (or 10.9%) presented genes that were exclusive to R. etli and B. elkanii; 288 (or 47.5%) presented genes in the three species simultaneously.
CONCLUSIONS The use of the OC Identifier tool gave satisfactory results, allowing clones from the shotgun genomic library to be used simultaneously in three different projects, and developing analysis with a partially sequenced genome. The use of this tool in conjunction with comparative genome analysis, biological databases, database query language, and bioinformatics tools allowed the identification of clones containing unique genes as an alternative to primer synthesis. The OC Identifier tool allowed clones to be analyzed during sequencing, making it possible to select genes of interest to create a DNA microarray. Knowing which genes exist in each clone permits us to avoid additional sequencing costs, reducing wasted time and resources in the future. Some examples of optimal clone selection using the OC Identifier tool can be viewed in the website http://lbmp.fcav.unesp.br/OC. The next version of this tool will be developed using process algebra, with the aim of improving the quality and the flexibility of the computing code, making searches and analyses of the clones more efficient. This new version will be used in the selection of clones to create a DNA microarray containing 90% B. elkanii genes for transcriptome analyses, phylogeny by CGH technique between the organisms A. caulidonans, B. elkanii, B. japonicum, M. huakuii, R. leguminosarum, and S. meliloti, and in the assembly of the B. elkanii genome for the next project conducted by the Biochemical Laboratory of Plants and Microorganisms at UNESP/Jaboticabal (http://lbmp.fcav.unesp.br). ACKNOWLEDGMENTS We acknowledge FAPESP, CNPq and CAPES for fellowships and collaborators from Biochemical Laboratory of Plants and Microorganisms (LBMP) at UNESP/Jaboticabal and Advanced Database Laboratory (LABD) at IME-USP. REFERENCES Altschul SF, Madden TL, Schaffer AA, Zhang J, et al. (1997). Gapped BLAST and PSI-BLAST: a new generation of protein database search programs. Nucleic Acids Res. 25: 3389-3402. Ankerst M, Ester M and Kriegel H-P (2000). Towards an effective cooperation of the user and the computer for classification. Proceedings of the 6th ACM SIGKDD International Conference on Knowledge Discovery and Data Mining, Boston, 179-188. Dall’Acqua WR (2004). DNA microarrays e hibridização DNA/DNA na caracterização de estirpes de rhizobium. MS thesis, Universidade Estadual Paulista, Faculdade de Ciências Agrárias e Veterinárias, Jaboticabal. Delcher AL, Harmon D, Kasif S, White O, et al. (1999). Improved microbial gene identification with GLIMMER. Nucleic Acids Res. 27: 4636-4641. Ewing B, Hillier L, Wendl MC and Green P (1998). Base-calling of automated sequencer traces using phred. I. Accuracy assessment. Genome Res. 8: 175-185. Gordon D, Abajian C and Green P (1998). Consed: a graphical tool for sequence finishing. Genome Res. 8: 195-202. Kaneko T, Nakamura Y, Sato S, Minamisawa K, et al. (2002). Complete genomic sequence of nitrogen-fixing symbiotic bacterium Bradyrhizobium japonicum USDA110. DNA Res. 9: 189-197. Koide T, Zaini PA, Moreira LM, Vencio RZ, et al. (2004). DNA microarray-based genome comparison of a pathogenic and a nonpathogenic strain of Xylella fastidiosa delineates genes important for bacterial virulence. J. Bacteriol. 186: 5442-5449. Lowe TM and Eddy SR (1997). tRNAscan-SE: a program for improved detection of transfer RNA genes in genomic sequence. Nucleic Acids Res. 25: 955-964. Okinaka Y, Yang CH, Perna NT and Keen NT (2002). Microarray profiling of Erwinia chrysanthemi 3937 genes that are regulated during plant infection. Mol. Plant Microbe Interact. 15: 619-629. Prado AL (2004). Hibridização DNA-DNA e expressão de genes simbióticos de Bradyrhizobium japonicum e B. elkanii através de DNA microarrays. PhD thesis, Universidade Estadual Paulista, Faculdade de Ciências Agrárias e Veterinárias, Jaboticabal. Rombel IT, Sykes KF, Rayner S and Johnston SA (2002). ORF-FINDER: a vector for high-throughput gene identification. Gene 282: 33-41. Safavian SR and Landgrebe D (1991). A survey of decision tree classifier methodology. IEEE Trans. Syst. Man. Cybern. 21: 660-674. Tusher VG, Tibshirani R and Chu G (2001). Significance analysis of microarrays applied to the ionizing radiation response. Proc. Natl. Acad. Sci. USA 98: 5116-5121. Watanabe T, Murata Y, Oka S and Iwahashi H (2004). A new approach to species determination for yeast strains: DNA microarray-based comparative genomic hybridization using a yeast DNA microarray with 6000 genes. Yeast 21: 351-365. Young JM, Kuykendall LD, Martínez-Romero E, Kerr A, et al. (2001). A revision of Rhizobium Frank 1889, with an emended description of the genus, and the inclusion of all species of Agrobacterium Conn 1942 and Allorhizobium undicola de Lajudie et al. 1998 as new combinations: Rhizobium radiobacter, R. rhizogenes, R. rubi, R. undicola and R. vitis. Int. J. Syst. Evol. Microbiol. 51: 89-103.
|
|||||||||||||||||||