![]()
![]()
![]()
![]()
![]()
![]()
![]()
![]()
![]()
![]()
![]()
| Genome-wide partial correlation analysis of Escherichia coli microarray data
D.F.T. Veiga1*, F.F.R. Vicente1*, M. Grivet2, A. de la Fuente3 and A.T.R. Vasconcelos1 Genet. Mol. Res. 6 (4): 730-742 (2007) ABSTRACT. Transcriptional control is an essential regulatory mechanism employed by bacteria. Much about transcriptional regulation remains to be discovered, even for the most widely studied bacterium, Escherichia coli. In the present study, we made a genome-wide low-order partial correlation analysis of E. coli microarray data with the purpose of recovering regulatory interactions from transcriptome data. As a result, we produced whole genome transcription factor regulation and co-regulation graphs using the predicted interactions, and we demonstrated how they can be used to investigate regulation and biological function. We concluded that partial correlation analysis can be employed as a method to predict putative regulatory interactions from expression data, as a complementary approach to transcription factor binding site tools and other tools designed to detect co-regulated genes. Key words: Partial correlation, Transcriptional regulation, Co-regulation, Microarray analysis, Gene expression, Escherichia coli INTRODUCTIONTranscriptional control is an essential regulatory mechanism employed by bacteria (Lin and Lynch, 1996). In this type of regulation, transcriptional factors (TFs) bind to an operon cis-regulatory region to induce or repress its expression. Nowadays, even for the most widely studied bacterium Escherichia coli, much about regulation remains to be discovered. Genome annotation carried out using sequence analysis tools, such as motif detection, was not able to assign transcriptional units to over 2,000 E. coli genes as found in RegulonDB (Salgado et al., 2006). At the same time, transcriptomic-related techniques, such as high-density oligonucleotide arrays as well as cDNA spotted arrays, have produced invaluable datasets that should be thoroughly studied to help elucidate the underlying regulatory mechanisms of biological systems (Brazhnik et al., 2002). These array experiments are largely publicly available in repositories such as Gene Expression Omnibus (GEO) at NCBI (Barrett et al., 2005) and ArrayExpress at EMBL (Parkinson et al., 2005). For E. coli, GEO has made 85 experiments (termed series) accessible, including 939 samples or hybridizations performed with various techniques1. A possible way to interrogate expression data is the following: Which genes have similar or dependent expression patterns? The ability to answer this question means that one is able to determine, among thousands of genes, which of them share some kind of biological association. Thus, relationships such as co-expressed genes, genes coding for protein complexes and even regulation by a TF and its target, ideally could be recovered from expression data. Since the expression profile of each gene can be seen as an n-dimensional continuous variable, X = {x1,...,xn}, with n observations, we can use correlation measures to identify such interactions. A widespread correlation measure is the Pearson correlation coefficient. This coefficient provides the degree of linear association between two variables, i.e., how well a linear equation describes the relationship between the variables. It has been applied as a similarity measure in clustering algorithms to group transcripts with similar expression patterns, in order to recognize genes involved in particular biological processes (Eisen et al., 1998; Quackenbush, 2001; Sharan et al., 2003). More recently, the partial correlation coefficient, another correlation measure, has been employed to explore transcriptome data (de la Fuente et al., 2004; Wille et al., 2004; Schäfer and Strimmer, 2005). Partial correlation can be used when we wish to evaluate the effect of the other variables in the original correlation. We can determine, for example, if the correlation between two variables is due to a third variable that is part of the system. The partial correlation is the correlation between X and Y conditioned by one or more control variables. A major consequence is that it is able to infer direct interactions within the set of observed variables, which is a requirement for causality (Pearl, 2000). Partial correlation has been applied for the reconstruction of gene networks, as the mathematical foundation for detecting meaningful interactions. Wille et al. (2004) proposed a modified graphical Gaussian model that includes edges using only first-order partial coefficients, i.e., an edge between genes i and j is drawn only if there is no single k ≠ i,j that completely explains the correlation between i and j. Also, Schäfer and Strimmer (2005) considered full-order partial correlations and adapted the modified graphical Gaussian model approach in order to obtain confident estimates, taking into account the undersampled nature of microarray data. de la Fuente et al. (2004) introduced the so-called undirected dependence graphs built from partial correlation coefficients up to second order. Using simulated data sets, they showed that considering partial correlation coefficients up to second order is sufficient to remove most of the undesired indirectly caused correlations and thus allows the construction of an undirected interaction graph with genes directly affecting each other. Their results on Saccharomyces cerevisiae gene expression data showed that partial correlation can identify clusters of genes with same biological function. This partial correlation approach allowed the assigning of functions to non-characterized open reading frames that remain associated with known genes. In the present study, we explored a large microarray dataset of E. coli Affymetrix GeneChips using partial correlation coefficients, in order to evaluate the information that this statistical measure is able to recover. For this task, we first used a gold-standard regulatory dataset assembled with the genes involved in the RegulonDB 5.0 transcriptional regulatory network (Salgado et al., 2006). Using low-order partial correlation, many TF interactions as well as co-regulated operons of the transcriptional network were correctly identified. Then, we expanded the analysis to the E. coli transcriptome and whole genome TF regulation and co-regulation graphs were built using the predicted interactions. These interactions can be seen as a feasible hypothesis that should be further investigated. We then chose some interactions to analyze and to demonstrate how correlation analysis can be employed to refine biological knowledge. At first, the partial coefficients were used to analyze artificial data generated with a non-linear transcription model for the motifs that occur in the transcription network of E. coli; these motifs can be fully reconstructed. METHODS Partial correlation: definition and application in a biological context The partial correlation is obtained by conditioning the Pearson correlation (also denoted by ‘zeroth order correlation’) between two variables on one or more controlling variables. Assume that p is the number of genes or probe sets in the dataset and n is the number of observations. Gene activities X1 K Xp , n-dimensional continuous variables, hold the measured quantity of transcripts across n arrays. Let Xi, Xj and Xk be the profiles of genes i, j and k, respectively. The partial correlation coefficient between Xi and Xj controlled by Xk, rij\k, is calculated as follows: i) Compute the residuals The order of partial correlation is determined by the number of variables conditioned on. To calculate second- or higher order coefficients, multiple regression is required. There are also equations to calculate the coefficients to some orders, as described elsewhere (Shipley, 2000). A statistical test is used to check if the correlation is significantly different from zero; the result should be interpreted as follows: 1) rij\k = 0 . In this case, the correlation between genes i and j exists due to the effect of gene k; therefore, it is an indirect interaction, without direct causal connection. We say that gene k can explain correlation rij, because it is: a) a common antecedent cause, i.e., k is a common regulator of genes i and j or b) an intermediate variable, i.e., k mediates the effect of i on j (or j on i): i affects k and k affects j (or j affects k and k affects i). 2) | rij\k | > 0. The correlation rij cannot be explained by k. If | rij\k | > 0 for all k ¹ i,j, there is a direct first-order dependence between profiles Xi and Xj. We used the partial coefficients to find meaningful relationships in transcriptome data. Example: structural motifs inferred by partial correlationTo evaluate the potential of this statistical measure for discovering biological interactions, we first applied it to synthetic microarray data, generated with Gepasi (Mendes, 1997), using the network motifs found in the transcriptional regulatory network of E. coli (Shen-Orr et al., 2002). The network motifs are patterns of interconnections that appear more often than in randomized networks; they are considered the simplest units that make up a transcriptional regulation system as a whole (Milo et al., 2002). Figure 1 (first column) presents the motifs for E. coli: feedforward motive (FFM), single-input motive (SIM) and the multi-input motive (MIM), each corresponding to a regulation strategy employed by the bacterium. A TF binds to an operon cis-regulatory region (Figure 1) to induce or to repress its transcriptional activity. In the FFM, a general TF1 regulates a specific TF2, and both cooperatively regulate Operon1. For the SIM, an operon set is exclusively controlled by a TF. Finally, in the MIM, an operon set is affected by a set of TFs, TF1 and TF2, possibly with opposite regulation signs. The non-linear dynamics of the transcriptional motifs was modeled through a system of ordinary differential equations, adapted from de la Fuente et al. (2004). Each equation describes the rate of expression of an operon or transcription factor and is composed by a synthesis and a degradation term. As an example, the system for the MIM network is described below 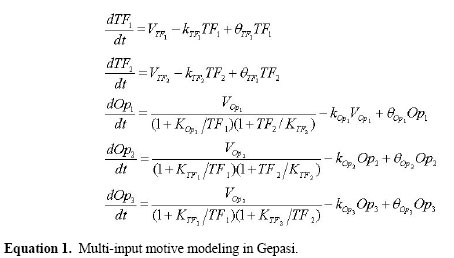
TFi and Opi are the measured quantity of transcript. Parameters Vi are maximum rates of transcription for each component, Ki are affinity constants for inhibitors and activators and ki are degradation rates. In the simulation we used Vi = Ki = ki = 1 and initial concentrations of 10-5 for all metabolites. The parameters qi mimic ubiquitous variability in biological systems. They were drawn from a normal distribution N(0, 0.01). The result is that for each θI, a slightly different system is configured. Using this approach, 103 θi were sampled and the steady state obtained in Gepasi, producing 103 observations. The same procedure was done with the FFM and SIM networks, which are described by a similar set of equations.
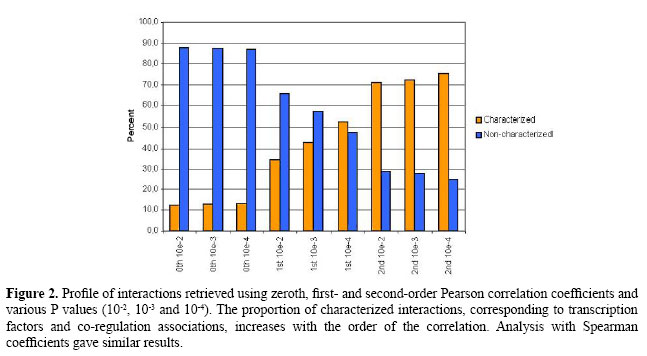
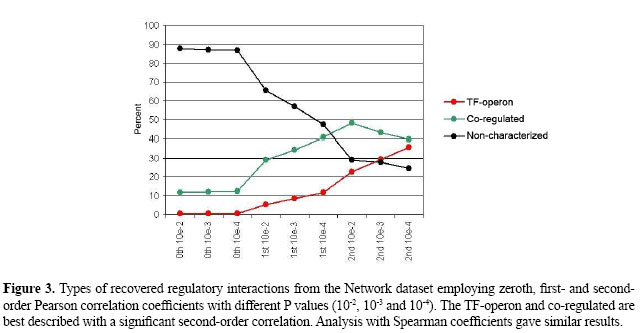
Next, we applied Pearson correlation using the generated expression data. Figure 1 shows the sequence of networks inferred with Pearson correlation coefficients of order 0 (Pearson 0th) and 1 (Pearson 1st), with the software ParCorA (de la Fuente et al., 2004). For the FFM, Pearson 0th and Pearson 1st found significant correlations among all components. This means that there are direct paths linking all elements in the network, and thus even The gene expression data comprising 58 observations, each corresponding to a single hybridization performed with an E. coli Antisense Genome Array chip, was downloaded from GEO (accession code GPL199). The preprocessing of raw data (CEL files), including quantification of probesets and normalization, was carried out using the mas5 algorithm available in Bioconductor (Gentleman et al., 2004). The annotation of probesets was performed with the aid of NetAffx online tool (Cheng et al., 2004). Perl scripts were used to process flat files of RegulonDB as well as for the analysis of the interactions predicted by the model. In the case of several probesets for the same gene, the mean expression level was assigned as the transcript quantity. RESULTSNetwork datasetThe first dataset consisted of 1077 genes (grouped into 434 operons and 137 transcription factors) and 58 observations. These genes make up the RegulonDB 5.0 E. coli transcriptional regulatory network; they were used as a curated regulatory dataset for validation of the correlation measure. We applied the zeroth-order Pearson correlation (Pearson 0th), first-order Pearson correlation (Pearson 1st) and second-order Pearson correlation (Pearson 2nd) to analyze this dataset. Each single analysis corresponds to a graph of interactions inferred with a defined order and P value. In the graph, each node corresponds to a regulator or operon, and an edge indicates direct dependence between expression profiles. We used very stringent P values (10-2, 10-3 and 10-4) to select correlations significantly different from zero and to control false positives. More elaborate multiple-testing procedures could also have been employed, such as controlling the False Discovery Rate (Schäfer and Strimmer, 2005). The graph interactions were classified according to the E. coli transcriptional network in three categories: TF-operon, co-regulated operons (i.e., operons with a common TF) and non-characterized associations. The output of the analysis is compiled in Figures 2 and 3.
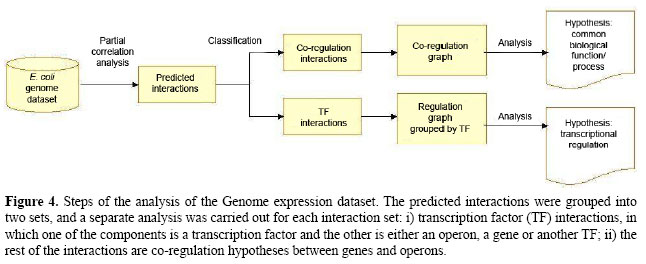
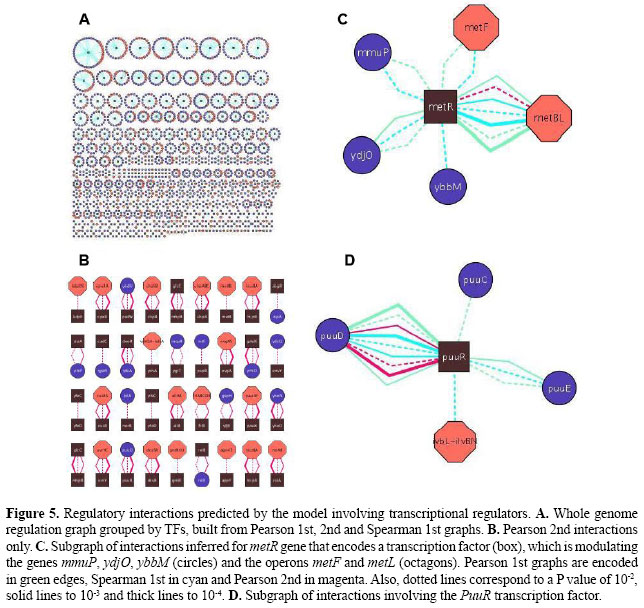
In the Pearson 0th graph, obtained using the common correlation without control and a P value of 10-2, a large number of edges were retrieved (93,641); only 12.2% of them could be characterized as TF-operon or co-regulated. With P values of 10-3 and 10-4, only 12.8 and 13.1% were characterized, respectively. As the order of correlation increased, the proportion of characterized associations also rapidly increased (Figure 2). This occurs because indirect associations were eliminated by applying controlled correlation. For instance, the Pearson 1st P value 10-2 graph had 886 interactions, including 65.6% uncharacterized and 34.4% characterized, the latter consisting of 5.4% TF-operons and 29% co-regulation. However, the best results were achieved with Pearson 2nd partial coefficients, for which more than 70% of predicted interactions had experimental evidence. As an example, the Pearson 2nd 10-4 P value graph found 35.8% TF-operon interactions and 39.6% associations between elements sharing a common regulator. The more we decrease the P value the more precise the inference (Figures 2 and 3), with the drawback of being very stringent and discarding some direct edges. For example, with Pearson 2nd and a P value of 10-4, 75.4% of links are experimentally known, although there was a reduction in the number of links identified, from 81 (with 10-2) to 40 interactions. This reduction also happens with 0th and 1st orders. In summary, this first analysis with a gold-standard dataset showed that the partial correlation was able to identify meaningful relationships; consequently, we expanded the analysis to the whole genome. Genome datasetWe assembled a whole transcriptome dataset with 784 operons, 261 transcriptional regulators and 2324 isolated genes, summing 4249 genes chosen for the analysis, or 95.36% of the genome. Among the remaining genes without a probeset in the array, there are recently identified RNA-encoding genes in intergenic regions such as psrA2 (Argaman et al., 2001) and prophage genes (extrachromosomal). The isolated genes are those without an associated transcription unit (i.e., nothing about their regulation is known). Also, we selected all experimentally determined regulators as well as putative or predicted TFs, according to protein functional annotation of RegulonDB. The preprocessing of expression data was performed in the same way as for the Network dataset. To carry out the transcriptome-wide analysis, we followed the steps shown in Figure 4. Initially, we applied the first-order and second-order Pearson correlation as well as first-order Spearman coefficients. To obtain the Pearson 2nd graph we employed a modified version of the software ParCorA, which is able to process thousands of variables in a relatively short time (it took 6.5 h with a Pentium 4 1.4 GHz processor). The predicted interactions were then grouped into two categories and a different approach was used to analyze each group. The correlation analysis identified, considering P values 10-2, 10-3 and 10-4, 12,419 associations in the Pearson 1st graph, 14,329 in the Spearman 1st graph and 387 interactions in the Pearson 2nd graph, with 312 of predicted co-regulation links (80.62%) and 75 involving TFs (19.38%). The TF interactions were organized into several clusters of associations centered in the transcriptional regulator (Figure 5A), which facilitates querying the associations inferred for a particular TF. The graphs were plotted using the Cytoscape software for analysis of biological networks (Shannon et al., 2003). We found interactions for 257 regulators of 261 and 13.07 interactions on average per regulator. Examining the whole genome graph, filters can be applied to select only interactions inferred in a determined correlation order, e.g., only Pearson 2nd interactions (Figure 5B).
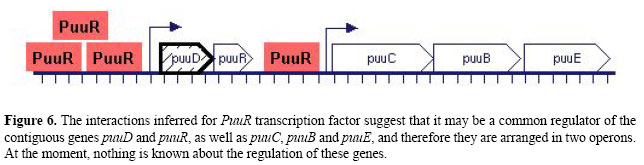
Figure 5C depicts the cluster of interactions inferred for metR. The MetR protein is a dual role transcription factor that controls several genes involved in the last step of methionine biosynthesis. It binds DNA to activate glyA, metA, metE, and metH genes as well as to repress its own expression. The inferred interactions around metR indicate that there is a significant second-order correlation with P value 10-2 (magenta dotted line) between metR and the operon metBL (see Figure 5C for edge coding). Also, we found first-order correlations with metF, mmuP, ydjO, ybbM, and metBL. The more associations supporting a relationship, the stronger the evidence for genetic regulation. Therefore, we selected metBL for further analysis. Both metB and metL are directly involved in methionine biosynthesis; metB encodes a subunit of O-succinylhomoserine(thiol)-lyase (complex of four MetB polypetides), an enzyme for the second reaction of the pathway, and metL encodes an aspartate kinase II that phosphorylates an L-aspartate molecule in the first step of the pathway. But the only known regulators of metBL are MetJ and PhoP. For this reason, operon metBL is a good candidate, suggested by the model to be directly regulated by metR. Experimental assays such as DNA footprinting can now be used to biochemically validate this computational prediction. The puuR subgraph is another example (Figure 5D). PuuR is a putative regulator of genes encoding enzymes in the putrescine degradation II pathway, a newly identified metabolic pathway for degradation of extracellular putrescine (Kurihara et al., 2005). At present there is no target validated for PuuR. The correlation analysis of expression profiles suggests that PuuR modulates the expression of puuD and puuC, whose products are enzymes of this pathway: a hydrolase and a dehydrogenase, respectively. Also, there is an interaction with puuE, which encodes for an aminotransferase of the 4-aminobutyrate degradation I pathway, a coupled metabolic route of putrescine degradation. Based on the annotation of the E. coli genome at EcoCyc, puuD, puuR, puuC, puuB, and puuE are contiguous in the DNA strand (Keseler et al., 2005). Therefore, partial correlation analysis hints that puuR is a regulator of the putative operons puuDR and puuCBE, probably by binding their promoter region, as illustrated in Figure 6.
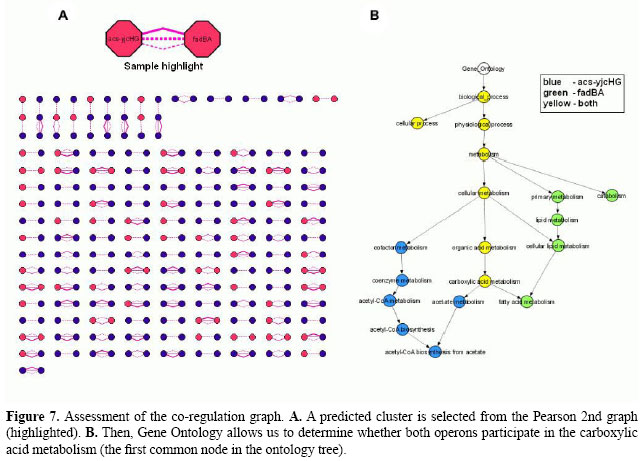
In the investigation of co-regulation interactions, analysis with Pearson 1st, 2nd and Spearman 1st has predicted 23,569 associations involving 3046 elements. The Pearson 2nd co-regulation graph can be seen in Figure 7A. It has 254 interactions among 273 nodes distributed in 132 clusters of related components. Using the Gene Ontology (GO) annotation for E. coli genes, we observed that among 48 clusters for which the annotation is complete, 54% (26 subgraphs) share a common biological process at level six of the ontology tree - a specialized process. For instance, both operons acs-yjcHG and fadBA are involved with carboxylic acid metabolism (see Figure 7B). These results confirm the ability of partial correlation coefficients to infer co-process interactions.
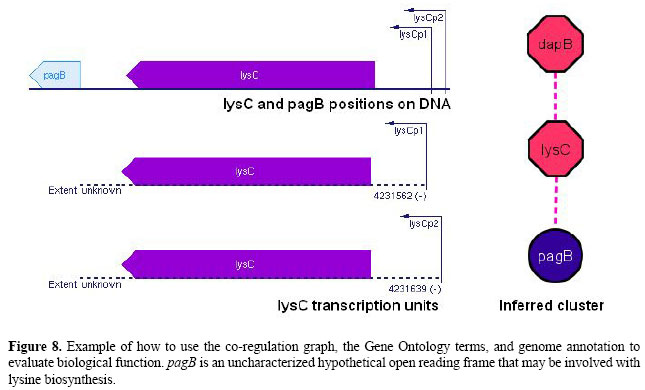
For each of the remaining 84 clusters in the co-regulation graph there is at least one gene without GO annotation. In Figure 8 we illustrate how the co-regulation graph and the GO annotation for E. coli can be used to assign biological function to these uncharacterized genes. Both operons dapB and lysC are known to participate in lysine biosynthesis. The last element of the cluster, pagB is a conserved hypothetical open reading frame with no assigned function according to EcoCyc and RegulonDB. The correlation analysis identified a significant Pearson 2nd correlation between the expression patterns of pagB and lysC, which hints that pagB might be involved with synthesis of this amino acid. Besides, as shown in Figure 8, the pagB sequence lies near lysC in the genome. CONCLUSIONSMining of both the E. coli transcriptional network microarray dataset as well as the whole genome dataset, using partial correlation coefficients, allowed us to recover regulatory interactions from the transcriptome. The Pearson 1st, 2nd and Spearman 1st correlation were able to capture biological meaningful causal and dependence relationships from the data, such as transcription factor and co-regulation associations.
Therefore, the partial correlation analysis can be employed as a method for prediction of putative regulatory interactions from expression data, as a complementary approach to transcription factor binding site tools and other tools designed to detect co-regulated genes. In this sense, the predicted interactions in this study can be seen as feasible hypotheses generated by the model that could be biochemically validated. Overall, these in silico predictions lead to the rationale design of new laboratory experiments, improving the chance of biological findings. In the near future, we intend to validate some in silico-discovered interactions through an experimental assay, such as chromatin immunoprecipitation or DNA footprinting. Other correlation measures, such as mutual information (Steuer et al., 2002) as well as gene networks reconstruction methods will also be applied to support our investigation of E. coli regulatory systems. Supplementary materialCytoscape files (.sif, .gml) for all the predicted graphs as well as the version of the software ParCorA used in this study are available at http://www.labinfo.lncc.br/publicacao/. ACKNOWLEDGMENTSThe authors thank Pablo Freire and Abel González for their useful insights concerning this study. We also acknowledge Conselho Nacional de Desenvolvimento Científico e Tecnológico (CNPq) for financial support. REFERENCESArgaman L, Hershberg R, Vogel J, Bejerano G, et al. (2001). Novel small RNA-encoding genes in the intergenic regions of Escherichia coli. Curr. Biol. 11: 941-950. Barrett T, Suzek TO, Troup DB, Wilhite SE, et al. (2005). NCBI GEO: mining millions of expression profiles - database and tools. Nucleic Acids Res. 33: D562-D566. Brazhnik P, de la Fuente A and Mendes P (2002). Gene networks: how to put the function in genomics. Trends Biotechnol. 20: 467-472. Cheng J, Sun S, Tracy A, Hubbell E, et al. (2004). NetAffx gene ontology mining tool: a visual approach for microarray data analysis. Bioinformatics 20: 1462-1463. de la Fuente A, Bing N, Hoeschele I and Mendes P (2004). Discovery of meaningful associations in genomic data using partial correlation coefficients. Bioinformatics 20: 3565-3574. Eisen MB, Spellman PT, Brown PO and Botstein D (1998). Cluster analysis and display of genome-wide expression patterns. Proc. Natl. Acad. Sci. USA 95: 14863-14868. Gentleman RC, Carey VJ, Bates DM, Bolstad B, et al. (2004). Bioconductor: open software development for computational biology and bioinformatics. Genome Biol. 5: R80. Keseler IM, Collado-Vides J, Gama-Castro S, Ingraham J, et al. (2005). EcoCyc: a comprehensive database resource for Escherichia coli. Nucleic Acids Res. 33: D334-D337. Kurihara S, Oda S, Kato K, Kim HG, et al. (2005). A novel putrescine utilization pathway involves gamma-glutamylated intermediates of Escherichia coli K-12. J. Biol. Chem. 280: 4602-4608. Lin ECC and Lynch AS (1996). Regulation of gene expression in Escherichia coli. Chapman & Hill, New York. Mendes P (1997). Biochemistry by numbers: simulation of biochemical pathways with Gepasi 3. Trends Biochem. Sci. 22: 361-363. Milo R, Shen-Orr S, Itzkovitz S, Kashtan N, et al. (2002). Network motifs: simple building blocks of complex networks. Science 298: 824-827. Parkinson H, Sarkans U, Shojatalab M, Abeygunawardena N, et al. (2005). ArrayExpress - a public repository for microarray gene expression data at the EBI. Nucleic Acids Res. 33: D553-D555. Pearl J (2000). Causality: models, reasoning, and inference. Cambridge University Press, New York. Quackenbush J (2001). Computational analysis of microarray data. Nat. Rev. Genet. 2: 418-427. Salgado H, Gama-Castro S, Peralta-Gil M, Diaz-Peredo E, et al. (2006). RegulonDB (version 5.0): Escherichia coli K-12 transcriptional regulatory network, operon organization, and growth conditions. Nucleic Acids Res. 34: D394-D397. Schäfer J and Strimmer K (2005). An empirical Bayes approach to inferring large-scale gene association networks. Bioinformatics 21: 754-764. Shannon P, Markiel A, Ozier O, Baliga NS, et al. (2003). Cytoscape: a software environment for integrated models of biomolecular interaction networks. Genome Res. 13: 2498-2504. Sharan R, Maron-Katz A and Shamir R (2003). CLICK and EXPANDER: a system for clustering and visualizing gene expression data. Bioinformatics 19: 1787-1799. Shen-Orr SS, Milo R, Mangan S and Alon U (2002). Network motifs in the transcriptional regulation network of Escherichia coli. Nat. Genet. 31: 64-68. Shipley B (2000). Cause and correlation in biology: A user’s guide to path analysis, structural equations and causal inference. Cambridge University Press, Cambridge. Steuer R, Kurths J, Daub CO, Weise J, et al. (2002). The mutual information: detecting and evaluating dependencies between variables. Bioinformatics 18 (Suppl 2): S231-S240. Wille A, Zimmermann P, Vranová E, Fürholz A, et al. (2004). Sparse graphical Gaussian modeling of the isoprenoid gene network in Arabidopsis thaliana. Genome Biol. 5: R92. 1Accession May 22, 2006. |
|
 by linearly regressing Xi against Xk, i.e.,
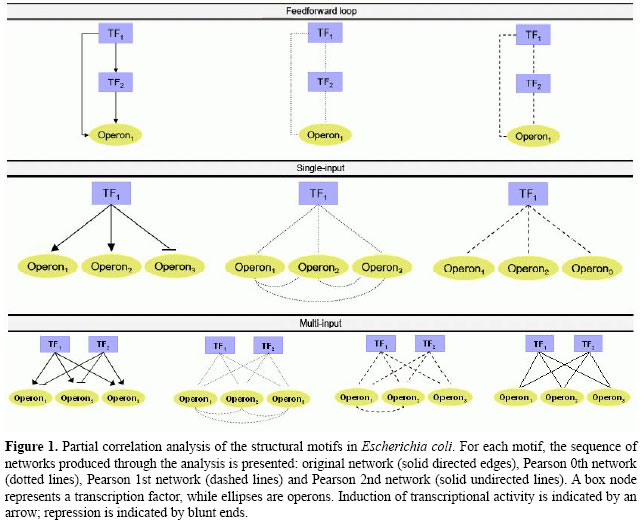
 remains significant. Next, for the SIM network we can see that the Pearson 0th network has more edges than the original. The interaction (Operon1,Operon2) was found because these operons are correlated mediated by TF1, or equivalently, TF1 is a common cause of Operon1 and Operon2. The same was observed with the interactions (Operon1,Operon3) and (Operon2,Operon3). Nevertheless, the Pearson 1st network identifies all interactions correctly as well as the sign of regulation. This network was constructed by conditioning the correlation among all possible pairs of variables to another control variable. Hence, when controlling with TF1,
  , and the edge is eliminated. Both