
Departamento de Biologia Geral, Instituto
de Ciências Biológicas,
Universidade Federal de Minas Gerais, Belo Horizonte, MG, Brasil
Corresponding author: E. Kalapothakis
E-mail: [email protected]
Genet. Mol. Res. 6 (4): 1026-1034 (2007)
Received May 15, 2007
Accepted October 6, 2007
Published November 27, 2007
ABSTRACT. We described five novel microsatellite loci for the piracema fish species Prochilodus lineatus (Characiformes), endemic to South America and of extreme importance to both commercial and artisanal fisheries across its occurrence area. A primary, unenriched genomic library was constructed and radioactively screened for repetitive motifs. Positive clones were automatically sequenced and based on the design of new primers, polymerase chain reaction assays were carried out to determine optimum reaction and electrophoretic conditions for each characterized locus. We evaluated its usefulness in population genetic studies by determining Hardy-Weinberg equilibrium, FIS and a jackknife estimate of the number of alleles for a sample of fish caught below the Funil Hydroelectric Power Plant dam (N = 95), Grande River, Brazil. The number of alleles varied from 3 to 21 and expected heterozygosities ranged from 0.58 to 0.91. Two of five loci were in Hardy-Weinberg equilibrium. Jackknife estimates of the number of alleles were higher than the observed number of alleles for three loci and could provide a measure of sampling bias. These markers should provide important tools for the determination of genetic structure, stock delimitation and reservoir fish management in the Grande River as well as to improve hatchery practices for environmental mitigation measures and to help sustain fisheries in the river.
Key words: Microsatellites, Piracema species, Prochilodus lineatus, Genomic library, Jackknife estimate, Fish
INTRODUCTION
Piracema is the term originally used by South American Tupi native nation to describe the reproductive migratory upstream run of freshwater species which takes place yearly, during the high rainy season (which in southeastern Brazil extends from about October to March). Today, it is commonly used to refer to Brazilian freshwater migratory fish, which constitutes a major group of species of great importance to local fisheries and riverine ecosystems. Prochilodus lineatus (Valenciennes, 1836 - Prochilodontidae: Characiformes) is a piracema species that occurs in the Paraná-Paraguay and Paraíba do Sul hydrographic basins in South America (Castro and Vari, 2003). It is a medium-sized, potamodromous, benthopelagic, detritivorous species and has been recorded to carry out migratory movements of as much as 1200 km/year (Godoy, 1975) and to reach up to 75 cm in total length (Castro and Vari, 2003). Previous population genetic studies of P. lineatus focused on mtDNA markers (Sivasundar et al., 2001) and on allozymes (Revaldaves and Renesto, 1997) pointed to a highly variable genetic diversity and lack of population structure within their respective analyzed geographic scales.
The Grande River is a major river in southeastern Brazil (~1300 km long), forming part of the Paraná-Paraguay basin and which is heavily impounded by a succession of 12 hydroelectric power plant dams (Paiva et al., 2002). Because of the environmental impact caused by those dams, the Grande River has been the target of intense restocking programs with P. lineatus, which are carried out as environmental impact mitigation measures. There are two main hatcheries in operation in the Grande River (Furnas and Volta Grande). However, stocking programs still lack deeper ecological and genetic assessments to evaluate their efficiency and best practice conduct (e.g., avoiding using fish from distinct river basins, avoiding the use of very few broodstock founders in hatcheries). Therefore, the characterization of molecular markers, aimed at population genetic studies of piracema fish, is of critical interest for conservation policies and fishery management efficiency.
The aim of the present study was the isolation of microsatellite loci useful for the population study of the Brazilian piracema species P. lineatus which plays a very important role in fisheries in the Grande River, MG, Brazil (Castro and Begossi, 1995) and in other river basins as well (Petrere, 1989).
MATERIAL AND METHODS
Microsatellite isolation
A primary genomic library of P. lineatus was constructed according to the following steps: total genomic DNA was extracted from 3 g of muscle tissue (Herrmann and Frischauf, 1987). Macerated tissue was put into TEN9 (50 mM Tris-HCl, pH 9.0, 100 mM EDTA, 200 mM NaCl) buffer with 0.1% SDS and 5 mg of proteinase K before it was incubated at 50°C for 12 h. Extractions were carried out with phenol (pH 7.4), phenol-chloroform (1:1) and then chloroform, and standard precipitations and quantification were performed. Genomic DNA was then digested with Sau3A1 and small fragments (<400 bp) removed using Sepharose 400 and Sephacryl 400 columns (GE Helthcare). Genomic DNA was then ligated in the pUC18 vector previously treated with BamHI, alkaline phosphatase and purified from the agarose gel. After transformation and selection (ampicillin and IPTG/x-gal), 2000 white colonies were collected and inoculated in 1 mL 2X YT liquid medium with ampicillin and incubated at 37°C for 8-12 h, prior to alkaline cell lysis and plasmid purification. Individual plasmids were spotted on a nylon membrane and screened for simple sequence interactions with 5’- end labeled 16-bp oligonucleotides (repeat motives: GATA, TATC, GACA, GGAT, TATT, TACT, CGGA, GTCA, CCGT, GAGG, GATT, CATG, CCAG, CATG, CCAG, CTTG, CAGC, TATG, TAGT, AAGT, AAGT, CAT, CAC, GTA, GAA, AAT, CTT, CAC, CCG, CAG, CA, CT, and TA). Oligo labeling was carried out with radioactive [γ32P] ATP (10 mCi/mL - GE Healthcare) using T4 kinase (5’ Labeling kit, GE Healthcare). After pre-hybridization (6X SSC (0.9 M NaCl, 0.09 M sodium citrate), 0.1% SDS and 5% BLOTO), membranes were incubated with hybridization buffer (6X SSC and 0.1% SDS) containing 5 ng/mL labeled probes for 14 h at 48°C. The membranes were then washed and exposed to autoradiography films (35 x 43 cm Kodak T-Mat G/RA) at -80°C for various periods (4-24 h). After each exposure, the membranes were washed in SSC buffer with varying conditions: increased temperatures (50° to 55°C) and diminishing salt concentrations (5 to 2X SSC) to progressively increase the hybridization stringency and for control of false-positive signals. Positive clones were spotted on a new membrane and subjected to a confirmatory hybridization. The resulting positive clones were used to transform TG1 Escherichia coli cells, and after purification, plasmids were submitted to sequencing in an MegaBace 96 capillary automatic sequencer, using DYEnamic ET Terminator Dye kits (GE Healthcare) and M13 primers (M13 - 20: GTAAAACGACGGCCAGT and M13 reverse: GGAAACAGCTAGACCATG). Sequences were screened for microsatellites using Tandyman (http://hpv-web.lanl.gov/tandyman/index.html; Leach R, unpublished results) and were further sequenced in both directions, so that consensus contigs could be built using Phred/Phrap/Consed (Ewing and Green, 1998; Gordon et al., 1998). Using specific primers (5 pmol of each), microsatellite polymerase chain reaction (PCR) products were screened for polymorphisms on 6-10% polyacrylamide gel electrophoresis performed with 2X TAE for 16 h at 75 V and stained with silver nitrate (Sambrook and Russell, 2001). Annealing temperature ranging from 50-70°C and Taq DNA polymerase (0.5 U DNA Taq Polymerase (Phoneutria), buffer IVB) were used. Gels were photographed and then scored with the aid of a 25-bp DNA ladder. PCR product fragment sizes were determined using the LabImage® software (Kaplan, Halle, Germany), grouped into allelic bin classes automatically with the aid of William Amos’ algorithm (Amos et al., 2007) and then manually checked.
Statistical analysis
Population genetic analyses were carried out using Genpop 3.4 (Raymond and Rousset, 1995). Hardy-Weinberg equilibrium (HWE) tests were conducted by the Markov Chain Monte Carlo method (Guo and Thompson, 1992) and the complete enumeration method for loci with four or fewer alleles (Louis and Dempster, 1987). FIS values were calculated by Weir and Cockerham’s estimator (1984). We used a jackknife resampling procedure (Efron, 1981) - jackknifing over individuals - to estimate the number of alleles and generate 95% confidence intervals. We also carried out an accumulation curve analysis to evaluate sample size effect in jackknife estimation of the number of alleles for each locus. These routines were performed with the EstimateS computer program (Colwell, 2000) treating alleles as biological species and individuals as sampling unities.
Population sampling
We extracted genomic DNA from 95 P. lineatus individuals caught right below the Funil Hydroelectric Power Plant dam (45° 02’ 16’’ W and 21° 08’ 36’’ S) in the Grande River, Minas Gerais, Brazil in December 2005, during the piracema run. Fish were net trapped and a small fin clip (1 cm2) was collected in a tube containing 70% ethanol. DNA extraction was carried out using 5% Chelex, 0.1% Tween-20 and 2 mg proteinase K.
RESULTS
Approximately 5.9% of the spotted plasmids showed positive hybridization to the pool of primers used in the radioactive screening. Sixty-seven positive clones were sequenced, from which 46 (68.6%) sequences showed at least a short microsatellite motif. Fifteen sequences were selected for primer construction. Upon PCR amplification, two loci showed monomorphic patterns, eight exhibited unspecific or uneven amplifications, and five were successfully standardized for populational analysis.
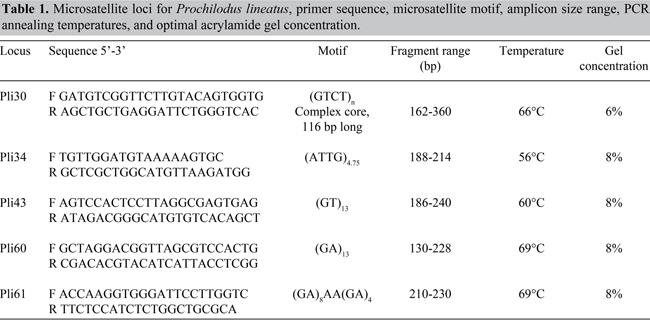
The five isolated loci were given names that started with the Pli prefix (from P. lineatus) followed by the clone number: Pli30, Pli34, Pli43, Pli60, and Pli61. Table 1 shows primer sequences, microsatellite motifs, amplicon size range, annealing temperature, and acrylamide gel concentrations for each locus. Amplified fragments ranged from 130-360 bp.
The novel microsatellite loci were applied to a population sample to evaluate their usefulness to population genetic analysis. Individual sample amplification success ranged from 85 to 97% (N = 95) among the five loci. The observed number of alleles ranged from 3 to 21. Jackknife estimates of the number of alleles were higher than the observed number of alleles, three of five times (Table 2 and Figure 1). Jackknife estimators could indicate the existence of non-sampled alleles in a population due to sample size and/or sampling bias. Figure 1 shows 95% confidence intervals of number of alleles. Confidence interval bars that overlap another locus’ jackknife estimate do not show statistical differences in the number of alleles (i.e., Pli43 and Pli60). Figure 2 shows the effect of sampling size in jackknife estimates of the number of alleles.
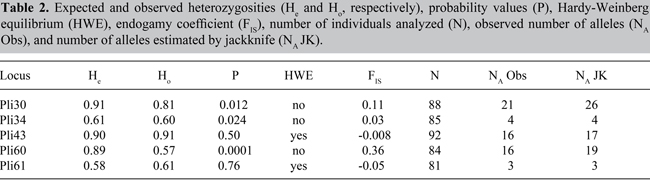
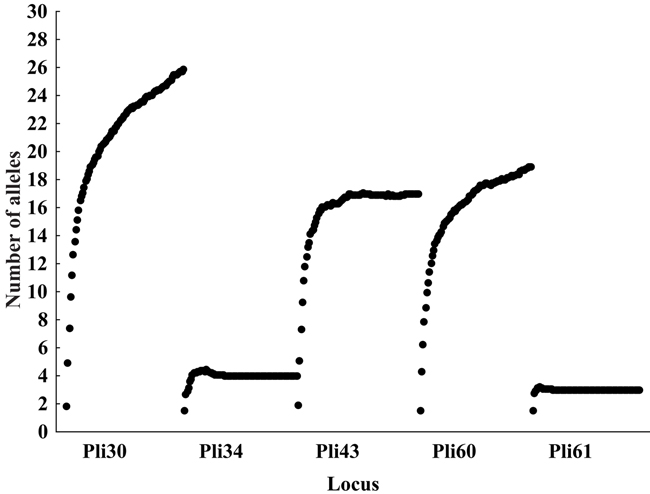
Figure 1. Accumulation curve of number of alleles, jackknife estimates under different sampling sizes. For each locus, from left to right, black dots represent number of alleles as a function of increasing sample sizes (starting from only one sampled individual).
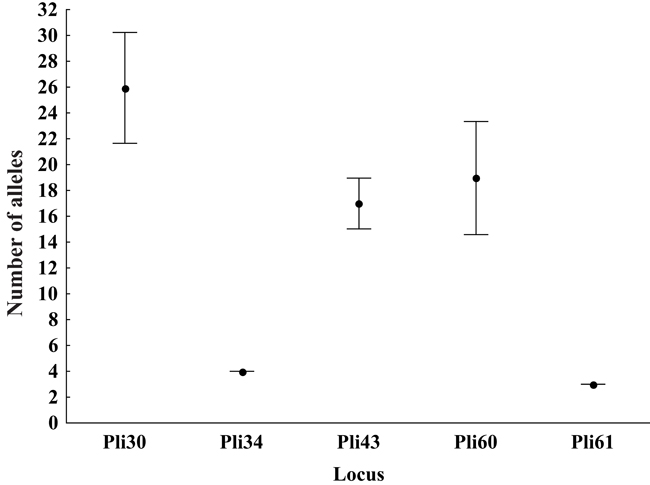
Figure 2. Jackknife estimate of number of alleles for each microsatellite locus. Vertical lines represent 95% confidence intervals: pair of loci where one’s jackknife estimates overlap another’s confidence interval ranges are considered to show no statistical differences in number of alleles.
The accumulation curve is plotted with randomized sample subsets, starting by sampling only one individual and estimating the number of alleles (i.e., one or two) and by subsequently adding one more individual to the sample and recalculating this value. Thus, Pli34 and Pli61 which showed the smaller number of alleles (four and three, respectively) quickly reach a plateau after few individuals are sampled. The shape of the curves for Pli30 and Pli60 suggests that further sampling could reveal new rarer alleles for those loci.
Table 2 also shows expected and observed heterozygosities, exact p values for HWE tests (α= 0.05), FIS estimates, and sample sizes. Expected heterozygosities ranged from 0.58 to 0.91, for the least and most polymorphic markers, respectively. Only two loci, Pli43 and Pli61, showed HWE (p > 0.05). Two of the remaining three loci, Pli30 and Pli60, displayed heterozygote deficit (p = 0.0001). Heterozygote deficit could be a sign of the presence of null alleles segregating or population sub-structuring (mixed stock). FIS, the inbreeding coefficient, ranged from -0.05 to 0.36. Negative FIS values can be indicative of heterozygote excess, which was not the case with our data (p > 0.5) nevertheless, and thus, these values should be regarded as zeros.
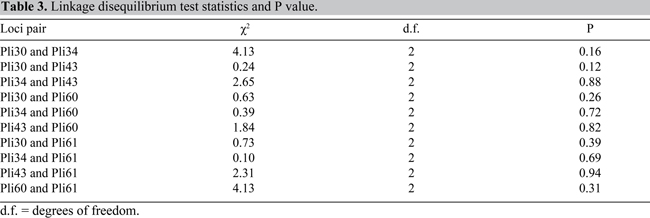
No possible locus pair showed linkage disequilibrium. Complete statistics summary for the linkage disequilibrium test can be seen in Table 3.
DISCUSSION
The P. lineatus genomic library developed in this study showed a higher percentage of positive clones (5.9%) than the average (3.1%) reported by Zane et al. (2002) for fish, when using methods similar to those employed here. A genomic library was constructed for this species, with genomic fragments over 400 bp. This library can be screened for other genes of potential interests. Many positive clones are still to be sequenced in search of new microsatellite markers. A large percentage (almost 69%) of positive sequenced clones showed inserts with repetitive motifs. Other di- and tetranucleotides were found as well as some trinucleotides. Some rarer microsatellite motifs such as octa- and hepta- and hexanucleotide were also found, as well as two minisatellites (12- and 13-bp repetition blocks - results not shown). Approximately 52% of the microsatellite motifs observed were dinucleotides (CA/GT and GA/CT).
Five microsatellites have been shown to produce diploid, polymorphic amplification patterns under tested conditions. Loci Pli30 and Pli34 have tetranucleotide core sequences, with Pli30 being an imperfect complex sequence. Loci Pli43, Pli60 and Pli61 showed dinucleotide motifs, with Pli61 displaying a small interruption in its core. Pli30 also showed a broader variation in PCR product length (~160-360 bp) with the most prevalent allele being 225 bp long. Annealing temperatures were rather high (up to 69°C) due to primers’ GC content and length.
These loci proved to be informative for population genetic analysis. Most of the 95 individuals used in population analysis responded positively to PCR assays, the poorest result being observed with Pli61, where 81 of the individuals (85%) showed amplification. This is probably due to PCR sensitivity to DNA concentration, which can vary considerably among individuals in a Chelex DNA extraction. The number of alleles varied from 3 to 21. The observation of the number of alleles, as well as their frequencies, depends critically on the binning method chosen (Amos et al., 2007). We opted for using Amos’ automated procedure and manually check for bin class assignments. Alternatively, we applied a jackknife estimator to determine the number of alleles (Table 2), because of its usefulness in accessing sample bias and its robustness in generating confidence intervals (Mooney and Duval, 1993). When sampling different individuals systematically reveal new alleles, confidence intervals are broader (e.g., Pli30 and Pli60) because standard deviations are higher (Figure 1). For the less polymorphic loci, Pli34 and Pli61, only a handful of individuals are needed to sample the different kinds of alleles present in the population (although many more could be necessary for an accurate estimation of their frequencies). Thus, the numbers of allele estimates are precise for our sampling size. Figure 1 also shows that Pli43 and Pli60 do not exhibit statistical difference for number of alleles, even though jackknife estimates vary if compared with the observed number of alleles. It is interesting to note in Figure 2 that before a critical level is attained, the jackknife estimator actually slightly overestimates the number of alleles for Pli34 and Pli61, an effect probably due to sampling bias (insufficient sampling). The shapes of the accumulation curves on Figure 2 for Pli30 and Pli60 do not seem to stabilize for our actual sample size. This could mean that, due to sampling bias, further sampling of the population could likely reveal new rarer alleles.
Pli30 and Pli60 were also the two loci to exhibit steep heterozygote deficit (p = 0.0001) and highest inbreeding coefficients (0.11 and 0.36, respectively). This could be attributed to the presence of null alleles at those loci, the existence of population sub-structuring in our sample (Wahlund effect), or a reflection of highly inbred individuals in the river due to hatchery supplementation activity on the Grande River, which produce large amounts of fish, from a small number of spawners (genetic bottleneck). The presence of null alleles could be addressed with paternity tests, with fish from hatcheries. The presence of sub-structuring is a plausible possibility since fish were caught right below Funil dam, which means that fish from different tributaries or regions of the Grande River could be meeting before the attempt to mount the river towards their spawning waters. The Funil Hydroelectric Power Plant started its commercial activities in 2002 and relies mainly on a fish elevator to take fish from below to above the dam, although the system seems to be more effective for small species such as the mandi (Pimelodus maculatus) - Yazbeck GM, personal observation. The effects of inbreeding due to few spawners in hatchery facilities in the Grande River are also possible, although we would expect a broader effect among the other loci, since endogamy promotes increasing homozygosities across all loci simultaneously. Further scrutiny of these hypotheses will need additional information and sampling of different populations in the hatcheries and in the river. No pair of loci exhibited linkage disequilibrium, indicating they all must segregate independently of each other.
The genetic markers described here will provide useful tools in the monitoring of P. lineatus population genetic structure and genetic diversity, as well as in hatchery operations, and they can be used in the evaluation of broodstocking success and its relevance in maintaining a substantial fish biomass for riverine populations, and commercial and artisanal fisheries in the Grande River and other basins.
ACKNOWLEDGMENTS
Research supported by CT-HIDRO/CNPq which also included a doctoral scholarship to G.M. Yazbeck. Authors would like to extend their thanks to Alexandre L. Godinho, the personnel at the Fish Passage Center (CTP/UFMG, Brazil), R. John Nelson (University of Victoria, BC, Canada) and to Joachim Carolsfeld, Brain Harvey and the personnel at the World Fisheries Trust (BC, Canada). This research was also supported by Fundação de Amparo à Pesquisa do Estado de Minas Gerais (FAPEMIG), Conselho Nacional de Desenvolvimento Científico e Tecnológico (CNPq) and PRONEX.
REFERENCES
Amos W, Hoffman JI, Frodsham A, Zhang JI, et al. (2007). Automated binning of microsatellite alleles: problems and solutions. Mol. Ecol. Notes 7: 10-14.
Castro F and Begossi A (1995). Ecology of fishing on the Grande River (Brazil): technology and territorial rights. Fish. Res. 23: 361-373.
Castro RMC and Vari RP (2003). Prochilodontidae (Fannel mouth characiforms). In: Checklist of the Freshwater Fishes of South and Central America (Reis RE, Kullander SO and Ferraris CJ Jr, eds.). Edipucrs, Porto Alegre, 65-70.
Colwell RK (2000). EstimateS: statistical estimation of species richness and shared species from samples, Version 6 Beta. User’s Guide and application. Available at http://purl.oclc.org/estimates. Accessed May 2006.
Efron B (1981). Nonparametric estimates of standard error: the jackknife, the bootstrap and other methods. Biometrika 68: 589-599.
Ewing B and Green P (1998). Base-calling of automated sequencer traces using phred. II. Error probabilities. Genome Res. 8: 186-194.
Godoy MP (1975). Peixes do Brasil, sub-ordem Characoidei da Bacia do Rio Mogi Guassu. Editora Franciscana, Piracicaba.
Gordon D, Abajian C and Green P (1998). Consed: a graphical tool for sequence finishing. Genome Res. 8: 195-202.
Guo SW and Thompson EA (1992). Performing the exact test of Hardy-Weinberg proportion for multiple alleles. Biometrics 48: 361-372.
Herrmann B and Frischauf AM (1987). Molecular cloning techniques. Methods Enzymol. 152: 180-183.
Louis EJ and Dempster ER (1987). An exact test for Hardy-Weinberg and multiple alleles. Biometrics 43: 805-811.
Mooney CZ and Duval RD (1993). Bootstrapping: a nonparametric approach to statistical inference. Sage Publication, Newbury Park.
Paiva MP, Andrade-Tubino MF and Godoy MP (2002). As represas e os peixes nativos do rio Grande. Interciência, Rio de Janeiro.
Petrere M (1989). River fisheries in Brazil: a review. Regul. Rivers Res. Manage. 4: 1-16.
Raymond ML and Rousset F (1995). An exact test for population differentiation. Evolution 49: 1280-1283.
Revaldaves E and Renesto E (1997). Genetic variability of Prochilodus lineatus (Characiformes:Prochilodontidae) in the upper Paraná River. Braz. J. Genet. 20: 381-388.
Sambrook J and Russell D (2001). Molecular cloning: a laboratory manual. 3rd edn. Cold Spring Harbor Laboratory Press, Cold Spring Harbor.
Sivasundar A, Bermingham E and Orti G (2001). Population structure and biogeography of migratory freshwater fishes (Prochilodus: Characiformes) in major South American rivers. Mol. Ecol. 10: 407-417.
Weir BS and Cockerham CC (1984). Estimating F-statistics for the analysis of population structure. Evolution 38: 1358-1370.
Zane L, Bargelloni L and Patarnello T (2002). Strategies for microsatellite isolation: a review. Mol. Ecol. 11: 1-16.