|
Genetic mapping of a new set of microsatellite markers in a reference common bean (Phaseolus vulgaris) population BAT93 x Jalo EEP558
M.C.M. Grisi1,2, M.W. Blair3, P. Gepts4, C. Brondani2, P.A.A. Pereira2 and R.P.V. Brondani2
1Escola de Agronomia, Universidade Federal de Goiás, Goiânia,GO, Brasil
2Embrapa Arroz e Feijão, Goiânia, GO, Brasil
3CIAT - International Center for Tropical Agriculture, Miami,FL, USA
4Department of Plant Sciences, Section of Crop and Ecosystem Sciences, University of California, Davis, CA, USA
Corresponding author: R.P.V. Brondani
e-mail: [email protected] Genet. Mol. Res. 6 (3): 691-706 (2007)
Received June 20, 2007
Accepted August 18, 2007
Published September 30, 2007 ABSTRACT. The present study describes a new set of 61 polymorphic microsatellite markers for beans and the construction of a genetic map using the BAT93 x Jalo EEP558 (BJ) population for the purpose of developing a reference linkage map for common bean (Phaseolus vulgaris). The main objectives were to integrate new microsatellites on the existing framework map of the BJ population, and to develop the first linkage map for the BJ population based exclusively on microsatellites. Of the total of 264 microsatellites evaluated for polymorphism, 42.8% showed polymorphism between the genitors. An integrated map was created totaling 199 mapped markers in 13 linkage groups, with an observed length of 1358 cM and a mean distance between markers of 7.23 cM. For the map constructed exclusively with microsatellites, 106 markers were placed in 12 groups with a total length of 606.8 cM and average distance of 6.8 cM. Linkage group designation and marker order for BM microsatellites generally agreed with previous mapping, while the new microsatellites were well distributed across the genome, corroborating the utility of the BJ population for a reference map. The extensive use of the microsatellites and the availability of a reference map can help in the development of other genetic maps for common bean through the transfer of information of marker order and linkage, which will allow comparative analysis and map integration, especially for future quantitative trait loci and association mapping studies. Key words: Reference map, Simple sequence repeat, common bean, legume genome
INTRODUCTION
Legumes (Leguminosae or Fabaceae) are the third largest family of higher plants (Gepts et al., 2005) with around 643 genera (18,000 species) that are grouped in 40 tribes (Broughton et al., 2003). Leguminous plants, after cereals, include the most important species of agricultural interest, considering area cultivated and total production (Gepts et al., 2005). The Leguminosae family is subdivided into three subfamilies, of which the subfamily Papilionoideae comprises most of the economically important legumes including the genus Phaseolus. Of the 50 described Phaseolus species, five (P. vulgaris, P. lunatus, P. coccineus, P. acutifolius, and P. polyanthus) are grown for human consumption; of these, the species P. vulgaris is the most cultivated worldwide, accounting for 75% of the food legumes traded in the world (Broughton et al., 2003). The areas of natural occurrence of P. vulgaris range from Mexico to Argentina, across tropical and subtropical regions of the Americas (Debouck et al., 1987). According to Food and Agriculture Organization data (FAO, 2006), the global production of common bean (P. vulgaris L.) was approximately 19 million tons in 2005, of which around 6 million tons were produced in Latin America and in the Caribbean. Brazil is worldwide the second producer of Phaseolus species and is ranked first in the production of P. vulgaris L. (Embrapa, 2004). In 2005, around 3 million tons of common bean were grown in an area of approximately 4 million hectares, with an annual increase estimated at 58.3 thousand tons of grains per year (Ribeiro et al., 2003). The common bean is a primary protein source in the diet of the low-income population in developing countries; aside from the high protein content, it contains large quantities of complex carbohydrates, fiber, oligosaccharides, and phytochemicals, such as polyphenols and isoflavones (Anderson et al., 1999). The common bean is also an important source of iron, phosphorus, magnesium, and manganese, and on a lower scale it provides zinc, copper and calcium (Broughton et al., 2003). The common bean (P. vulgaris L.) genome has an estimated size of 650 million base pairs (Mb) per haploid genome, distributed among 11 chromosomes (Arumuganatham and Earle, 1991). Genetic maps for common bean have been available since the 1990s and are based on the combination of different molecular marker classes, with a predominance of co-dominant restriction fragment length polymorphism (RFLP) markers (Chase et al., 1991; Vallejos et al., 1992; Nodari et al., 1993a,b; Vallejos, 1994), followed by the development of maps containing a large number of dominant random amplified polymorphic DNA (RAPD) markers (Adam-Blondon et al., 1994). A central genetic map for common bean integrated the mapped marker information from different populations in a common population (BAT93 x Jalo EEP558), where segregation data of 563 markers were combined into a single reference map covering a total genetic distance of 1226 cM (Freyre et al., 1998). An increasing number of genetic maps are being developed in common bean for the identification of quantitative trait loci (QTLs) or genes controlling important traits of economic interest; nevertheless, the information tends to be restricted to the mapped populations since the transferability of the molecular markers in use is low. This is a constraint for the realization of comparative genome studies and, consequently information exchange across different maps. Consequently, the establishment of reference maps could provide an important tool to integrate the information obtained across various genetic studies. Microsatellite markers are useful for genetic studies because they are co-dominant, multi-allelic, widely distributed across the genome, polymerase chain reaction (PCR)-based, and transferable between different genotypes. Information generated by these markers allows comparisons and information exchange between different studies, especially for comparative genetic mapping (Grattapaglia, 2000). Recently, several research groups have made advances in the development of microsatellite markers for various species of the Leguminosae family (Song et al., 2004; Wang, et al., 2004). For common bean, microsatellites have been developed from GenBank sequences and enriched genomic libraries. The first GenBank-based microsatellites were developed by Yu et al. (1999, 2000), who generated a set of 38 simple sequence repeat (SSR) markers, followed by Blair et al. (2003) and Guerra-Sanz (2004), who developed 57 and 20 additional SSRs, respectively. The first SSRs derived from enriched genomic libraries were obtained by Gaitán-Solís et al. (2002), resulting in the development of 68 markers, and Yaish and Pérez De La Vega (2003), who isolated an additional series of 21 SSRs. Since then, Caixeta et al. (2005) used size-fractionated bacterial artificial chromosome (BAC) libraries to develop SSRs linked to a resistance gene, and more recently, Buso et al. (2006) developed a further set of SSRs derived from genomic libraries. Microsatellite markers have been useful in genetic mapping in common bean with a set of 15 SSRs integrated into the BAT93 x Jalo map by Yu et al. (2000), and 100 more SSRs integrated into a comparative map between BAT93 x Jalo EEP558 and DOR364 x G19833 (Blair et al., 2003). Recently, Blair et al. (2006b) and Ochoa et al. (2006) used microsatellites from various sources to create genetic maps for an advanced backcross population and a recombinant inbred line population with over 80 microsatellite markers each. The development of a genetic reference map for common bean, based on genetically more informative markers with wide genome coverage and with transferability to other crosses, would help to establish correlations between maps based on independent experiments. Such information could readily be used to guide QTL mapping analyses based on the use of markers located in regions of interest in the genetic map. In this study, our main objectives were: 1) to screen microsatellite markers and identify those polymorphic for the BAT93 x Jalo EEP558 population; 2) to integrate a set of new microsatellite markers into the core map for this population based on RFLP and RAPD markers that were previously mapped in the same population, and 3) to compare the integrated map with a genetic map based exclusively on microsatellites. The utility of the information generated by this study in the development of a microsatellite-based reference genetic map for common bean is discussed.
MATERIAL AND METHODS
Plant materialThe P. vulgaris mapping population was derived from a cross of the parents BAT93 and Jalo EEP558. The parent BAT93 is an improved line from the breeding program of the Centro Internacional de Agricultura, Cali, Colombia, and belongs to the Mesoamerican gene pool; while cultivar Jalo EEP558 was released by the Estação Experimental de Patos de Minas, Brazil, and belongs to the Andean gene pool (Nodari et al., 1993a). The cross was made at the University of California for the construction of the genetic map of Nodari et al. (1992), and was advanced by single-seed descent through successive generations of inbreeding for the establishment of a population of recombinant inbred lines in the F8 generation. Simple sequence repeat amplification and analysis
Genomic DNA extraction based on the plant material of the parents and 71 recombinant inbred lines followed the procedure described by Grattapaglia and Sederoff (1994). Three hundred and seven SSR markers developed for common bean were used, 304 being from genomic libraries and three expressed sequence tag (EST)-derived SSR markers. The 304 SSRs were obtained from 68 markers of the series AG, GATS and BM (Gaitán-Solís et al., 2002), 21 markers of series M (Yaish and Pérez De La Vega, 2003) and 215 markers of series PVBR. From this series, 20 (PVBR1-PVBR25) have been published (Buso et al., 2006), and the remaining markers (not published before) that showed polymorphism in BAT93 x Jalo EEP558 population are available at the NCBI web site http://www.ncbi.nlm.nih.gov/entrez/query.fcgi?db=nucleotide&cmd=search&term=BUSO according to the GenBank number described in Table 1. The three EST-derived SSRs were PV-ag005, BMd33 and BMd41 (Yu et al., 2000; Blair et al., 2003). All 307 SSRs were adjusted for PCR amplification conditions and tested for parental polymorphism between the parents BAT93 and Jalo EEP558. The SSRs that did not amplify at the standard temperature of 56°C were subjected to new amplifications, where the annealing temperature was reduced to between 42° to 54°C. Meanwhile, the annealing temperature was increased to between 58° and 60°C for the SSRs with multiple banding patterns at the standard temperature of 56°C, in order to increase the specificity of the amplified product. PCR was performed in a final volume of 15 µl, containing 15 ng DNA, 0.3 µM of each primer (forward and reverse), 0.25 mM of each dNTP, 5% DMSO, 10 µM Tris-HCl, pH 8.3, 50 mM KCl, 1.5 mM MgCl2 and one unit Taq DNA polymerase. The reactions were carried out in a PT 100 MJ Research thermocycler, programmed for one pre-cycle at 94°C for 1 min, followed by 30 cycles at 94°C for 1 min, specific annealing temperature of the primer for 1 min, 72°C for 1 min, and a final step at 72ºC for 7 min. Segregation analysis of polymorphic SSRs was carried outon 5% agarose gels stained with ethidium bromide (0.1 µg/µl), or on 6% denaturing polyacrylamide gels with silver staining (Creste et al., 2001).
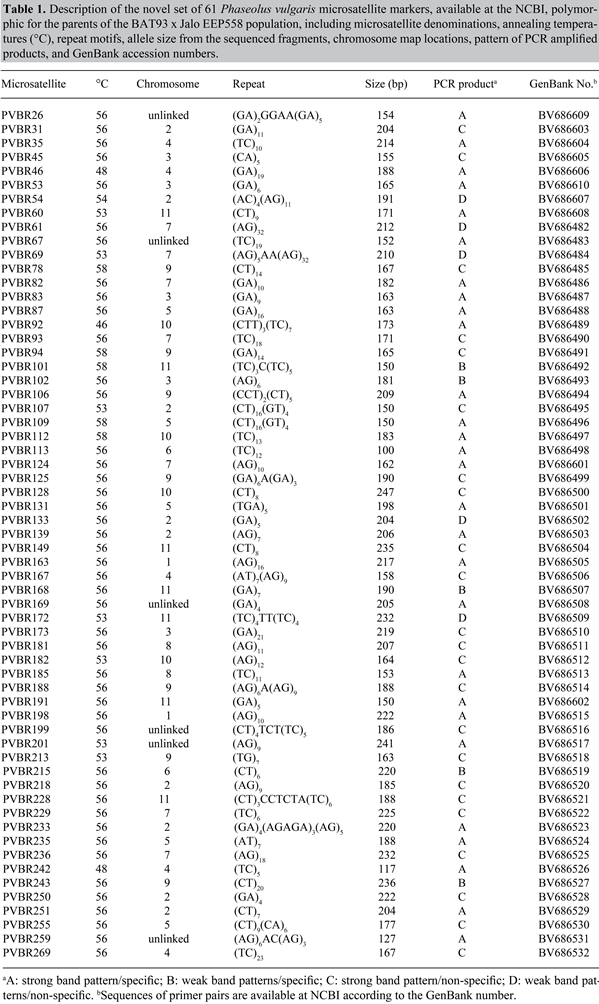 Linkage analysesChi-square (χ2) tests were performed to test the null hypothesis which states that the segregation ratios fit the expected 1:1 marker segregation, considering P < 0.05. The false discovery rate (FDR) statistical method, determined from the observed p value distribution, was used in order to correct for multiple comparisons by controlling the chance of a false-positive (Benjamini and Hocheberg, 1995). Initially, the polymorphic SSR markers were integrated in a framework map composed of 118 markers, including RAPD, RFLP, SCAR (sequence-characterized amplified regions), and isozymes (http://agronomy.ucdavis.edu/gepts), previously genotyped in the BAT93 x Jalo EEP558 population. For the linkage analysis based exclusively on SSR markers, 10 additional loci (BM046, BM137, BM158, BM199, BMd12, BMd18, BMd19, BMd40, BMd42, and BMd47) previously mapped by Blair et al. (2003) in the BAT93 x Jalo EEP558 population, were included in the final SSR data set. Individual linkage analyses were performed using MapMaker 2.0 (Lander et al., 1987) for Macintosh. Linked markers were first placed into linkage groups using the “group” command with logarithm of odds (LOD) score ranging from 3.0 to 5.0 and a maximum recombination fraction (theta) of 0.30. The “first-order” and “compare” commands were used to identify the most probable marker order within a linkage group. The “ripple” command was used to verify the order and establish a log-likelihood support. Recombination fractions were transformed to estimate map distances by the Kosambi map function. Chromosome numbering followed that proposed by Pedrosa et al. (2003). RESULTSSelection of simple sequence repeat lociAfter optimization of the PCR conditions for the 307 SSRs examined on polyacrylamide gels, a total of 23 (7.5%) of the markers (all from the PVBR series) did not amplify under the minimal stringency conditions and 20 SSRs (6.5%) resulted in patterns of non-specific bands, which were not used for additional analysis (11 from the PVBR series, 7 from the M series and 2 from the BM series). Regarding the quality of the PCR amplification product, 198 SSRs (75%), from the 264 useful markers, amplified products with a strong band pattern, of which 76 clearly produced a sharp band, and 122 amplified interpretable PCR products, but with some degree of stuttering. The remaining 66 (25%) pairs of primers showed weak patterns, but still useful for genotyping, with 34 SSRs producing sharp bands and 32 producing some stuttering. A total of 264 (86%) SSRs amplified clearly interpretable products and were used in the polymorphism screening for the parents of the BAT93 x Jalo EEP558 population (181 of series PVBR, 66 of series BM, 14 of series M, 2 of series BMd, and 1 from the series PV). From these, 176 (66.7%) amplified at an annealing temperature of 56°C. Simple sequence repeat polymorphism in Bat93 and Jalo EEP558A total of 113 of the 264 SSRs tested for polymorphism between BAT93 and Jalo were polymorphic, of which 39 belonged to the BM series, 69 to the PVBR series, 2 each to the BMd and M series and 1 to the PV series. Eight of the 69 PVBR markers have been published (Buso et al., 2006) and the remaining 61 are described in Table 1. The information about this new set of 61 markers is available at the NCBI web site, including primer pair sequences, repeat sequences and DNA sequences that were used to design the primers. A set of 24 (21.2%) SSR loci could be easily interpretable on agarose gels (BM141, BM152, BM153, BM154, BM160, BM167, BM187, BM200, BM211, 11M1, 13M1, PVBR6, PVBR25, PVBR31, PVBR87, PVBR94, PVBR113, PVBR163, PVBR181, PVBR185, PVBR218, PVBR255, PVBR259, and PVBR269), while the remaining 89 (78.8%) were genotyped on polyacrylamide gels (Figure 1).
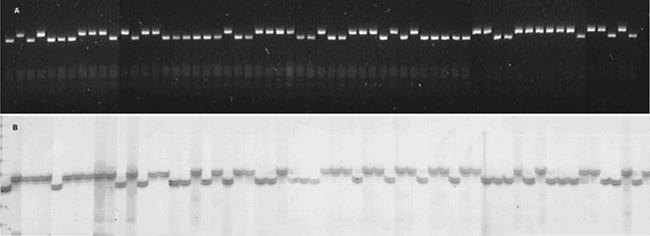
Figure 1. Segregation at microsatellite loci BM152 (panel A) and BM181 (panel B) in BAT93 x Jalo EEP558 population, with detection on agarose and polyacrylamide gels, respectively. The two first lanes are the two parents followed by the progeny. Linkage analysesThe integration of the SSRs in the core linkage map resulted in a dataset of 231 polymorphic markers including the 113 SSRs and 118 previously mapped markers. Of these, a total of 199 (86.1%) markers could be mapped at an LOD score ≥3 (theta = 0.35) and were distributed in 13 linkage groups (Figure 2). Nine linkage groups corresponded to an entire chromosome of P. vulgaris, while two chromosomes (6 and 10) were represented by partial linkage groups. For chromosome 6, one partial linkage group (6b) had no mapped SSRs but represented RFLP and RAPD markers placed at the end of the chromosome according to Pedrosa et al. (2003), which were mapped at a minimum LOD score of 3.0. The partial linkage groups could be merged by the markers BMd33 (chromosome 6) and N9b (chromosome 6b) but at a lower LOD score of 2.3. For chromosome 10, the linkage group formed by three markers BM161, D1174 and RF10b (10b), could be anchored to the marker D1298 (chromosome 10) at an LOD of 1.6 and BM161 was also mapped to this same chromosome in the comparative map of Blair et al. (2003).
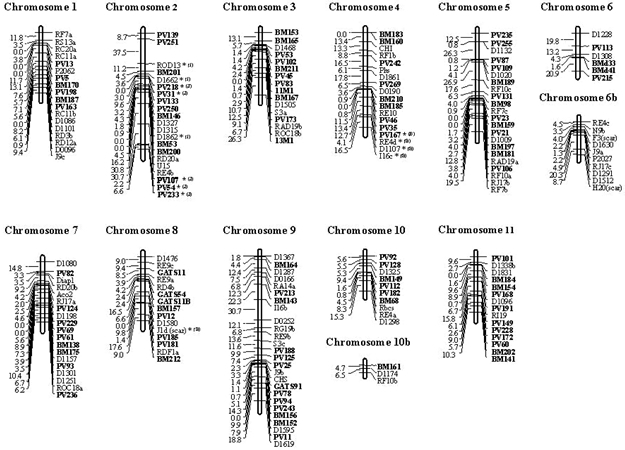
Figure 2. Common bean linkage map based on the analysis of 231 molecular markers, including 113 microsatellites, developed based on the segregation analysis of the population BAT93 x Jalo EEP558. The 104 microsatellite markers integrated in the map with a minimum LOD of 3.0 are indicated in bold; microsatellites with segregation deviation are starred (*level of significance of 5%) and labeled with (B) or (J), which expresses the predominance of alleles of the parental BAT93 or Jalo EEP558, respectively. The total number of markers mapped per linkage group varied from three (chromosome 10b) to 26 (chromosome 9), and the mean interval between two markers was 7.2 ± 1.9 cM (standard deviation), with a maximum distance between two markers of 37.5 cM (PVBR251 and ROD13, chromosome 2). The size of the linkage groups varied from 11.2 (chromosome 10b) to 224.3 cM (chromosome 9), with a mean size of 104.5 ± 58.2 and a total map distance estimated to be 1358 cM (Table 2).
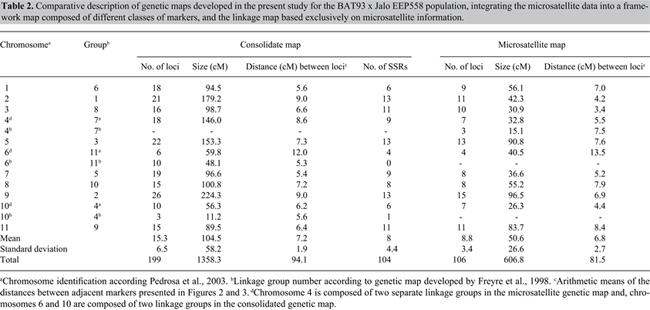
Microsatellite-based mapIn addition to mapping the SSRs into the integrated genetic map described above, we also performed a linkage analysis based exclusively on SSR markers, totaling 123 markers (113 polymorphic in the present study and 10 previously mapped). In this analysis, a total of 106 (86.18%) were found to be linked and were distributed across 12 linkage groups (Figure 3) at the level of statistical stringency adopted. Ten linkage groups corresponded to approximately complete chromosomes of P. vulgaris as identified by Pedrosa et al. (2003), while chromosome 4 was represented by two partial linkage groups, one with seven SSRs and the other with three markers. The number of SSR markers per chromosome varied from four (chromosome 6) to 15 (chromosome 9), with a mean of 8.8 markers per chromosome. The greatest distance between the markers was 22.3 cM on chromosome 5, while the overall mean distance between markers was 6.8 ± 2.7 cM. Linkage group size varied from 15.1 to 96.5 cM for linkage group 4b and chromosome 9, respectively, with a mean size of 50.6 ± 26.60 cM. The total map distance was estimated to be 606.8 cM (Table 2). The LOD values between the linked and unlinked markers varied from 0.49 to 2.79.
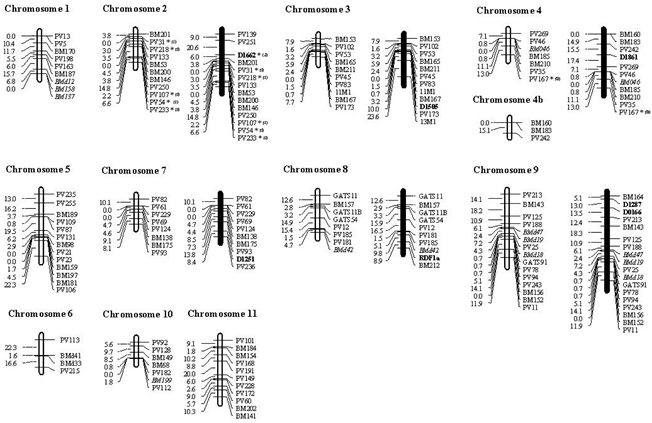
Figure 3. Common bean linkage map based on microsatellite markers only, developed on the segregation analysis of the population derived from the crossing BAT93 x Jalo EEP558. On the left are the linkage groups that contain only microsatellite markers, and on the right (in bold) the groups containing the anchor markers. The microsatellites were mapped with a minimum LOD of 3.0; the markers with deviation of segregation are starred (*level of significance of 5%) and labeled with (B) or (J) which expresses the predominance of alleles of the parental BAT93 or Jalo EEP558, respectively. Seven markers (6 RFLP and 1 RAPD), previously mapped and dispersed throughout the genome in the core linkage map, were used as anchor loci for 6 SSRs in the SSR linkage map as shown in Figure 3. The addition of marker D1662 allowed the linkage of the SSRs PV139 and PV251 on chromosome 2; markers D0166 and D1287 allowed the linkage of SSR BM164 on chromosome 9; marker D1251 allowed the linkage of SSR PV236 on chromosome 7, and marker D1505 anchored the SSR 13M1 on chromosome 3. In addition, marker RDF1a allowed the linkage of SSR BM212 on chromosome 8, which agreed with previous results (Blair et al., 2003). On chromosome 4, the addition of marker D1861 allowed the linkage between the two groups (chromosome 4 and chromosome 4b), resulting in the expected final number of 11 chromosomes. Segregation distortion, as analyzed by FDR statistics, showed that for 7 (6.2%) new SSR loci and 11 (9.3%) previously mapped markers (indicated by asterisks in Figures 2 and 3), the null hypothesis of segregation 1:1 was rejected at a significance level of α = 0.05. In relation to the segregation distortion, 12 markers were skewed toward the Andean parent Jalo EEP558, while 6 were skewed toward the Mesoamerican parent, BAT93. Among the 22 SSRs mapped by Blair et al. (2003) in this population, only one (BMd40) presented segregation deviation with χ2 = 36.48. All loci with segregation deviation were maintained in our linkage analysis. When analyzing the 18 distorted SSR markers, 13 were mapped across three linkage groups of the BAT93 x Jalo EEP558 population map and the majority of these loci, all 8 skewed toward Jalo EEP558 alleles, were clustered on chromosome 2. The remaining five distorted markers, skewed toward BAT93, were mapped on chromosomes 4 (four distorted markers) and 8 (one distorted marker). Despite the distortion, all mapped loci were placed with a minimum LOD value of 3.06. DISCUSSIONThis study reveals a novel set of 61 microsatellite markers that showed a good pattern of amplification, most of them under the same PCR amplification conditions, allowing a high-throughput genotyping with a broad range of applications for genetic analysis in common bean. Together with the previously developed microsatellite markers for beans, an exclusively microsatellite-based linkage map was constructed, making their map position available which could be used to align existing maps for P. vulgaris. Using a protocol of PCR optimization, the efficiency of selecting a set of markers that showed strong and specific PCR products and that could be potential markers for the development of semi-automated genotyping systems for common bean was 25%, of a total of 307 SSRs tested. As previously reported by Masi et al. (2003), these systems, once developed and adjusted, have numerous advantages over conventional microsatellite analysis, allowing the simultaneous analysis of a greater number of loci, increasing the precision of data acquisition and reducing the time spent for genotyping a large number of plants. Estimates of the efficiency of SSR recovery for common beans are available in the literature, and similar levels of recovery have been found. Blair et al. (2003) found successful amplification in 92.6% of genomic SSRs and 81.1% of gene-derived SSRs, while Yaish and Pérez De La Vega (2003) had a success rate of 80.9% for genomic SSRs, and Yu et al. (2000) found that 81% of GenBank-derived SSRs amplified satisfactorily. In the present study, based on only three EST-derived SSRs, it was not possible to make conclusions about the information content of this type of SSR. In common bean, Blair et al. (2003) estimated a polymorphism rate between Andean and Mesoamerican genotypes of around 4% for EST-derived markers versus 60% for genomic-derived markers. Despite the lower polymorphism rate of EST-SSRs, the 21,000 P. vulgaris EST sequences available in GenBank represent a potential source of informative microsatellites (Ramirez et al., 2005), with the additional possibilities of electronic search and sampling of expressed gene regions and a greater probability of transferability of SSR loci among related species (Cho et al., 2000; Thiel et al., 2003). The occurrence of null alleles in microsatellites has been observed in different species (reviewed by Dakin and Avise, 2004), and can result from mutations (deletions or substitutions) at the primer annealing site and/or large insertions within the amplified sequence. In this study, the occurrence of null alleles was inferred in six loci (5.3%), predominantly associated with the BAT93 parent (5 loci), and was interpreted as missing data, in order to prevent a mistaken genotyping of the population that could lead to the deviation of the expected proportion of Mendelian segregation. Overall SSR polymorphism in the BAT93 x Jalo cross was relatively high (42.8%) but lower than that observed for some other inter-gene pool parental combinations in which the polymorphism can average 59.7% (Blair et al., 2006a). Crosses involving parents from different domestication centers are desirable for genetic mapping, since the possibility of detecting polymorphism among parents, derived from wild beans which had diverged before domestication, is increased, resulting in a higher number of segregating loci. Conversely, the polymorphism level tends to be lower in crosses among genotypes from within the same gene pool as reported by Frei et al. (2005) and Blair et al. (2006a), where polymorphism can range from 14 to 34% for the Mesoamerican gene pool but slightly higher for the Andean gene pool. Inter-racial parental combinations tend to be lower than between race combinations, especially with parents from the same commercial seed class (Blair et al., 2006a, and Brondani RPV, unpublished data). Based on these findings, low polymorphism can be attributed to the narrow genetic base observed in some groups of cultivated common bean as found by Maciel et al. (2003) for AFLP markers in commercial cultivars developed by a single-breeding program, where many of the genotypes shared common genealogies. Among other legumes, soybean cultivars have a narrower genetic base, in which a mapping analysis by Brogin (2005) targeting the identification of the rust resistance gene, found only 15% of SSRs polymorphic between the parents, which had common ancestors in their genetic background. For the linkage map based on a combined dataset of markers using a minimal LOD score of 3.0 and theta of 0.40, a total of 199 markers were placed in 13 linkage groups, regarding the expected number of 11 chromosomes in P. vulgaris. The two exceeding groups represented unlinked portions of chromosomes 6 and 10 previously mapped. Two approaches could be used to attain the expected number of chromosomes: either by increasing population size, or by including additional markers that would fill the present gaps, bridging linked and unlinked genetic markers. The availability of some common set of SSR markers mapped among individual linkage maps developed for beans allowed the recognition of homologous linkage groups among them, and also comparative analysis regarding the linkage conservation of the markers in the same linkage groups. The position of the BM series microsatellites agreed well with the same SSRs mapped in either the BAT93 x Jalo EEP558 or DOR364 x G19833 population by Blair et al. (2003), with the exception of three markers, BM167, BM189 and BM201, which were on chromosomes 3, 5 and 2 in this study but in linkage groups b08, b03 and b07, respectively, in their study. Potential clusters of microsatellites were identified on chromosomes 1, 2, 3, 5, 7, and 9, as also found by Blair et al. (2003). Apart from this clustering, the SSR markers were well distributed among the linkage groups, ranging from 4 to 13 SSRs per chromosome. Some intervals over 20 cM remained, but were located mainly on chromosome 2. These findings corroborate a previous report of low SSR polymorphism in the same regions (Blair et al., 2006b). Alternative strategies could help to fill the gaps, such as the use of BAC libraries, already available for common bean (Kami et al., 2006), to be used to anchor markers on the physical map, and to identify and to develop specific markers for the under-represented genomic region. This strategy has been shown to be an effective way to target for low-density marker regions on the soybean genome (Song et al., 2004). Another approach to fill the gaps in linkage maps is to make an assessment of the correspondence between the physical and genetic distances in beans, in order to estimate the sizes of the gaps, helping to elucidate aspects related to recombination in the genome, as performed for the entire rice genome (Chen et al., 2002). The cross-referencing of genetic information among maps could also help to reduce the gaps, especially among populations showing high polymorphism such as those of Blair et al. (2006b) and Ochoa et al. (2006). The consolidation of linkage information will also provide the possibility to obtain a more consistent genetic map by increasing the number of markers well distributed along the genome and keeping, from the set of common mapped markers, those that are shown to be more robust (conservation of the marker order and linkage) in linkage experiments. In this regard, knowing that the distribution of the SSRs across the genome is not random and that the SSR frequency, of mostly trinucleotide repeats, is higher in transcribed regions, especially non-translated portions (Morgante et al., 2002), the use of SSRs derived from expressed sequences could help to reduce the large intervals between markers and increase the representation of markers across specific regions of the genome. Additionally, the use of a higher number of microsatellites close to genes would be, from the point of view of the genetic application of these markers, particularly interesting, due to the possibility to map-expressed sequences, resulting in the development of a transcriptional map, which would provide a valuable resource for future studies of linkage disequilibrium in beans. Of the 123 polymorphic SSR markers analyzed here, a total of 106 were successfully mapped onto the framework maps and distributed throughout the P. vulgaris genome. The total SSR map length, previously estimated to be 1226 cM for the same mapping population in the core map of Freyre et al. (1998), was decreased by about 50% in the SSR map length. Since the sample size and mapping generation was the same, this variation in the estimate of genome size is probably due to the higher marker density of the previous map, in addition to the use of different classes of markers which could show differences in their genomic distributions (Paglia et al., 1998). Some markers were assigned to linkage groups of the core map with a likelihood support of 100:1, which also may have contributed to the extension of the linkage map and an increase of the observed map length differences. Even though a considerable number of the 123 microsatellite markers used in the linkage analysis could be mapped, some RFLP and RAPD markers were required as anchor loci for the integration of some lower LOD SSRs and to make the linkage between the two groups, resulting in the reduction of the number of linkage groups from 12 to the expected final number of 11. This procedure demonstrated the need for incorporation of a larger number of SSR markers for the establishment of a map with greater representativeness of the common bean genome. The ease of working with PCR-based microsatellite markers, the high specificity of the amplified products, the potential of transferability across gene pools, and the multi-allelism provided by these markers justify and motivate the great effort towards the development of linkage maps based on microsatellite markers. Considering a total of 231 segregant markers, only 11.6 were expected to be distorted by chance at P ≤ 0.05. However, a total of 7.8% (18 markers) were identified. In relation to previous studies in beans where an index of 18% distorted markers was reported for the same mapping population (Freyre et al., 1998), the rate of distorted markers was reduced. In the present study, the chi-square test performed alone resulted in similar values of distorted markers (22%). However, the use of the FDR method allowed the control of the FDR based on multiple comparison tests (Benjamini and Yekutieli, 2001). Using the same mapping population, an analysis based on previously published results by Freyre et al. (1998) indicated agreement in the mapping patterns of the distorted markers for chromosomes 2, 4 and 8, as well as the mapping of genes related to the domestication syndrome also identified on chromosome 2 (Koinange et al., 1996; Blair et al., 2006b). The majority of the distorted loci was clustered mainly in two linkage groups, keeping blocks of skewed markers toward the same parental, reinforcing the hypothesis that the distortion had a biological basis and that these genotypes had some evolutionary advantage and were selected for in developmental processes (Xu et al., 1997). In conclusion, the development of a useful genetic reference map for P. vulgaris with higher resolution, co-dominant, multiallelic, and consequently more informative molecular markers, in addition to unified nomenclature through correlation between chromosome and linkage groups, will increase the power of comparative analyses between linkage maps and gene tagging or QTL mapping studies using populations with varying genetic backgrounds. The SSR markers, mapped and integrated in this study along with those from Yu et al. (2000) and Blair et al. (2003), may allow further information exchange between maps obtained with different segregating populations and the anchoring of the genetic map to physical maps in the future, which is the first step in the cloning of important genes for common bean improvement. These additional microsatellite markers can be used to increase map saturation, conduct associative mapping, anchor BAC clones, and also to conduct precise QTL mapping. Concerning the possibility to extrapolate the comparative linkage analyses across legume species, greater efforts are being made to integrate markers derived from expressed sequences, since these gene sequences are more closely related and are expected to provide valuable anchor points across the genomes. In addition, a set of EST-SSR loci from different legume species, mainly soybean, has been screened for polymorphism in BAT93 x Jalo EEP558 and other common bean mapping populations, aiming to integrate genetic data. Once a map for common bean is available integrating linkage information from several legume species, more genomic information will be added to the Legume Information System, allowing the expansion of comparative genomic analyses. This will provide new insights into legume genome organization studies and into predicting the location of genes related to important traits from one species to another, as successfully demonstrated for other model crops (Devos and Gale, 2000). ACKNOWLEDGMENTSWe acknowledge the financial support from the Brazilian National Research Council (CNPq) fellowship to R.P.V. Brondani and Ministry of Education CAPES MSc fellowship to M.C.M. Grisi. REFERENCES
Adam-Blondon AF, Sévignac M, Dron M and Bannerot H (1994). A genetic map of common bean to localize specific resistance genes against anthracnose. Genome 37: 915-924. Anderson JW, Smith BM and Washnock CS (1999). Cardiovascular and renal benefits of dry bean and soybean intake. Am. J. Clin. Nutr. 70: 464S-474S. Arumuganatham K and Earle ED (1991). Nuclear DNA content of some important plant species. Plant Mol. Biol. Rep. 9: 208-218. Benjamini Y and Hocheberg Y (1995). Controlling the false discovery rate: a practical and powerful approach to multiple testing. J. Roy. Stat. Soc. 57: 289-300. Benjamini Y and Yekutieli D (2001). The control of the false discovery rate in multiple testing under dependency. Ann. Stat. 29: 1165-1188. Blair MW, Pedraza F, Buendia HF, Gaitán-Solís E, et al. (2003). Development of a genome-wide anchored microsatellite map for common bean (Phaseolus vulgaris L.). Theor. Appl. Genet. 107: 1362-1374. Blair MW, Giraldo MC, Buendia HF, Tovar E, et al. (2006a). Microsatellite marker diversity in common bean (Phaseolus vulgaris L.). Theor. Appl. Genet. 113: 100-109. Blair MW, Iriarte G and Beebe S (2006b). QTL analysis of yield traits in an advanced backcross population derived from a cultivated Andean x wild common bean (Phaseolus vulgaris L.) cross. Theor. Appl. Genet. 112: 1149-1163. Brogin RL (2005). Mapeamento de genes de resistência a ferrugem e de qtls envolvidos na resistência a Septoriose em soja. MSc thesis, Esalq, Piracicaba. Broughton WJ, Hernández G, Blair MW and Beebe S (2003). Beans (Phaseolus spp.) - model food legumes. Plant Soil 252: 55-128. Buso GSC, Amaral ZPS, Brondani RPV and Ferreira ME (2006). Microsatellite markers for the common bean - Phaseolus vulgaris. Mol. Ecol. Notes 6: 252-254. Caixeta ET, Borem A, Alzate-Marin AL, Fagundes S, et al. (2005). Allelic relationships for genes that confer resistance to angular leaf sport in common bean. Euphytica 145: 237-245. Chase CD, Ortega VM and Vallejos CE (1991). DNA restriction fragment length polymorphisms correlate with isozyme diversity in Phaseolus vulgaris L. Theor. Appl. Genet. 81: 806-811. Chen M, Presting G, Barbazuk WB, Goicoechea JL, et al. (2002). An integrated physical and genetic map of the rice genome. Plant Cell 14: 537-545. Cho YG, Ishii T, Temnykh S, Chen X, et al. (2000). Diversity of microsatellites derived from genomic libraries and GenBank sequences in rice (Oryza sativa L.). Theor. Appl. Genet. 100: 713-722. Creste S, Tulmann-Neto A and Figueira A (2001). Detection of single sequence repeat polymorphisms in denaturing polyacrylamide sequencing gels by silver staining. Plant Mol. Biol. Rep. 19: 299-306. Dakin EE and Avise JC (2004). Microsatellite null alleles in parentage analysis. Heredity 93: 504-509. Debouck DG, Lifian JJH, Campanas AS and de la Cruz Rojas JH (1987). Observations on the domestication of Phaseolus lunatus L. Plant Genet. Resour. Newsl. 70: 26-32. Devos KM and Gale MD (2000). Genome relationships: the grass model in current research. Plant Cell 12: 637-646. EMBRAPA (2004). Sistemas de produção do feijoeiro. http://sistemasdeproducao.cnptia.embrapa.br/FontesHTML/Feijao/CultivodoFeijoeiro/importancia.htm. Accessed October 2006. FAO (2006). Food and agriculture organization of the United Nations - statistical database. http://www.fao.org/faostat. Accessed November 2006. Frei A, Blair MW, Cardona C, Beebe SE, et al. (2005). QTL mapping of resistance to Thrips palmi Karny in common bean. Crop Sci. 45: 379-387. Freyre R, Skroch PW, Geffroy V, Adam-Blondon AF, et al. (1998). Towards an integrated linkage map of common bean. 4. Development of a core linkage map and alignment of RFLP maps. Theor. Appl. Genet. 97: 847-856. Gaitán-Solís E, Duque MC, Edwards KJ and Tohme J (2002). Microsatellite repeats in common bean (Phaseolus vulgaris): isolation, characterization and cross-species amplification in Phaseolus ssp. Crop Sci. 42: 1228-1236. Gepts P, Beavis WD, Brummer EC, Shoemaker RC, et al. (2005). Legumes as a model plant family. Genomics for food and feed report of the cross-legume advances through genomics conference. Plant Physiol. 137: 1228-1235. Grattapaglia D (2000). Molecular breeding of Eucalyptus: state of the art, applications and technical challenges. In: Molecular Markers and Genome Mapping in Woody Plants (Jain SM and Minocha SC, eds.). Kluwer Academic Publishers Group, Netherlands, 451-474. Grattapaglia D and Sederoff R (1994). Genetic linkage maps of Eucalyptus grandis and Eucalyptus urophylla using a pseudo-testcross: mapping strategy and RAPD markers. Genetics 137: 1121-1137. Guerra-Sanz JM (2004). Short communication - New SSR markers of Phaseolus vulgaris from sequence databases. Plant Breed. 123: 87-89. Kami J, Poncet V, Geffroy V and Gepts P (2006). Development of four phylogenetically-arrayed BAC libraries and sequence of the APA locus in Phaseolus vulgaris. Theor. Appl. Genet. 112: 987-998. Koinange MK, Singh SP and Gepts P (1996). Genetic control of the syndrome in common bean. Crop Sci. 36: 1037-1045. Lander ES, Green P, Abrahamson J, Barlow A, et al. (1987). Mapmaker: an interactive computer package for constructing primary genetic linkage maps of experimental and natural populations. Genomics 1: 174-181. Maciel FL, Echeverrigaray S, Gerald LTS and Grazziotin FG (2003). Genetic relationships and diversity among Brazilian cultivars and landraces of common beans (Phaseolus vulgaris L.) revealed by AFLP markers. Genet. Resour. Crop Evol. 50: 887-893. Masi P, Spagnoletti-ZeulI PL and Donini P (2003). Development and analysis of multiplex microsatellite markers sets in common bean (Phaseolus vulgaris L.). Mol. Breed. 11: 303-313. Morgante M, Hanafey M and Powell W (2002). Microsatellites are preferentially associated with nonrepetitive DNA in plant genomes. Nat. Genet. 30: 194-200. Nodari RO, Koinange EMK, Kelly JD and Gepts P (1992). Towards an integrated linkage map of common bean. I. Development of genomic DNA probes and levels of restriction fragment length polymorphism. Theor. Appl. Genet. 84: 186-192. Nodari RO, Tsai SM, Gilbertson RL and Gepts P (1993a). Towards an integrated linkage map of common bean. II. Development of an RFLP-based linkage map. Theor. Appl. Genet. 85: 513-520. Nodari RO, Tsai SM, Guzmán P, Gilbertson RL, et al. (1993b). Toward an integrated linkage map of common bean. III. Mapping genetic factors controlling host-bacteria interactions. Genetics 134: 341-350. Ochoa IE, Blair MW and Lynch JP (2006). QTL analysis of adventitious root formation in common bean (Phaseolus vulgaris L.) under contrasting phosphorus availability. Crop Sci. 46: 1609-1621. Paglia GP, Olivieri AM and Morgante M (1998). Towards second-generation STS (sequence-tagged sites) linkage maps in conifers: a genetic map of norway spruce (Picea abies K.). Mol. Gen. Genet. 258: 466-478. Pedrosa A, Vallejos CE, Bachmair A and Schweizer D (2003). Integration of common bean (Phaseolus vulgaris L.) linkage and chromosomal maps. Theor. Appl. Genet. 106: 205-212. Ramírez M, Graham MA, Blanco-López L, Silvente S, et al. (2005). Sequencing and analysis of common bean ESTs. Building a foundation for functional genomics. Plant Physiol. 137: 1211-1227. Ribeiro ND, Possebon SB and StorcKL (2003). Progresso genético em caracteres agronômicos no melhoramento do feijoeiro. Ciência rural 33: 629-633. Song QJ, Marek LF, Shoemaker RC, Lark KG, et al. (2004). A new integrated genetic linkage map of the soybean. Theor. Appl. Genet. 109: 122-128. Thiel T, Michalek W, Varshney RK and Graner A (2003). Exploiting EST databases for the development and characterization of gene-derived SSR-markers in barley (Hordeum vulgare L.). Theor. Appl. Genet. 106: 411-422. Vallejos CE (1994). Phaseolus vulgaris: the common bean. In: DNA-Based Markers in Plants, Dordrecht (Phillips RL and Vasil IK, eds.). Kluwer Academic Publishers Group, Netherlands, 261-270. Vallejos CE, Sakiyama NS and Chase CD (1992). A molecular marker-based linkage map of Phaseolus vulgaris L. Genetics 131: 733-740. Wang XW, Kaga A, Tomooka N and Vaughan DA (2004). The development of SSR markers by a new method in plants and their application to gene flow studies in azuki bean [Vigna angularis (Willd.) Ohwi and Ohashi]. Theor. Appl. Genet. 109: 352-360. Xu Y, Zhu L, Xiao J, Huang N, et al. (1997). Chromosomal regions associated with segregation distortion of molecular markers in F2, backcross, doubled haploid, and recombinant inbred populations in rice (Oryza sativa L.). Mol. Gen. Genet. 253: 535-545. Yaish MWF and Pérez De La Vega M (2003). Isolation of (GA)n microsatellite sequences and description of a predicted MADS-box sequence isolated from common bean (Phaseolus vulgaris L.). Genet. Mol. Biol. 26: 337-342. Yu K, Park SJ and Poysa V (1999). Abundance and variation of microsatellite DNA sequences in beans (Phaseolus and Vigna). Genome 42: 27-34. Yu K, Park SJ, Poysa V and Gepts P (2000). Integration of simple sequence repeat (SSR) markers into a molecular linkage map of common bean (Phaseolus vulgaris L.). J. Hered. 91: 429-434. |
