![]()
![]()
![]()
![]()
![]()
![]()
![]()
![]()
![]()
![]()
![]()
| Comparative study of the cuticular hydrocarbon in queens, workers and males of Ectatomma vizottoi (Hymenoptera, Formicidae) by Fourier transform-infrared photoacoustic spectroscopy
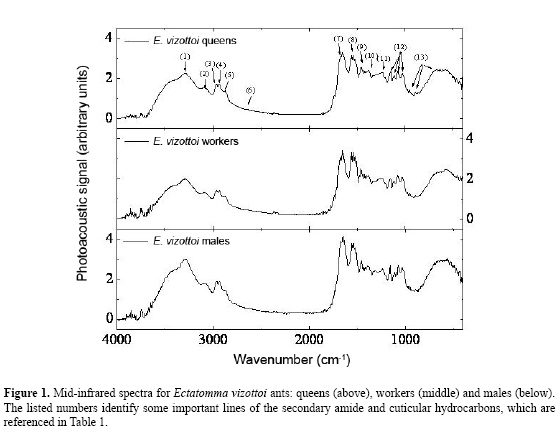
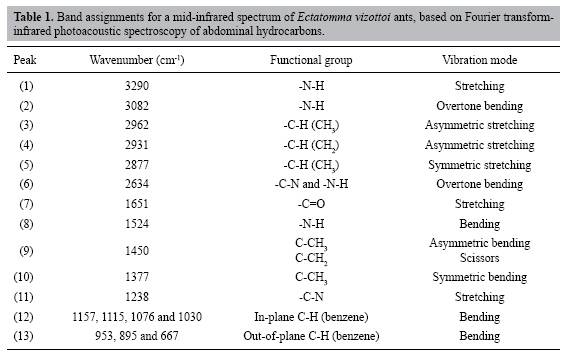
W.F. Antonialli Junior, S.M. Lima, L.H.C. Andrade and Y.R. Súarez Centro Integrado de Análise e Monitoramento Ambiental, Universidade Estadual de Mato Grosso do Sul (UEMS), Dourados, MS, Brasil Corresponding author: W.F. Antonialli Junior E-mail: [email protected] Genet. Mol. Res. 6 (3): 492-499 (2007) Received April 2, 2007 Accepted May 8, 2007 Published August 27, 2007 ABSTRACT. Fourier transform-infrared photoacoustic spectroscopy was applied for the first time, to our knowledge, to distinguish different castes of an ant species. The method was applied directly to the abdomen of queens, workers and males of Ectatomma vizottoi ants, without any special sample preparation. The absorption bands of secondary amide and hydrocarbons were identified; using these as variables in a canonical discriminant analysis we found significant differences between the castes. Queens have a greater hydrocarbon content than do workers and males, which is related to their function in the colony. This technique can be used to analyze and distinguish small chemical differences in biological systems, even in opaque samples. Key words: Infrared photoacoustic spectroscopy, Ectatomma vizottoi, Cuticular hydrocarbon, Castes INTRODUCTION Pheromones play a key role in many aspects of the life of insects, and are generally divided into two categories: light, volatile substances secreted by glands and long hydrocarbonated chains found on the cuticle (reviewed in Howard, 1993). Cuticular hydrocarbons are included in the class of releasers known as "surface pheromones". These pheromones are important for social insects because they allow the recognition of conspecifics, nestmates, kin, or even members of different castes (Blomquist et al., 1998; Lenoir et al., 1999). Recent studies suggest that the hydrocarbon contents of the different castes in a colony may be involved in nestmate recognition (Blomquist et al., 1998; Lenoir et al., 1999). Hydrocarbons have been examined in studies of reproduction regulation in social insects (Peeters et al., 1999; Liebig et al., 2000). In many species of social insects, the cuticular hydrocarbons of adults vary with colony and with individual physiology (oogenesis) (Blomquist et al., 1998; Lenoir et al., 1999). Dietemann et al., 2003 also suggested that cuticular hydrocarbons allow recognition of the queen as well as egg-laying workers. These various studies analyzed hydrocarbon types and levels in different castes of social insects by using gas chromatography coupled with mass spectrometry or solid-phase micro-extraction methods (Dietemann et al., 2003). Although these methods are very reliable and provide good quantitative analyses, they require several sample preparation steps and a long time to give a result. An alternative method using Fourier transform-infrared photoacoustic spectroscopy (FTIR-PAS) is proposed herein, for rapid identification (<1 min) of different castes in a colony. During the last few years, FTIR spectrometry has been combined with attenuated total reflectance, diffuse reflectance spectroscopy, and PAS, or simply with transmittance, in order to detect contamination of fungi on the surface of corn (Greene et al., 1992; Gordon et al., 1997), and to evaluate cheese (McQueen et al., 1995), chocolate (Belton et al., 1988) and pea seed quality (Letzelter et al., 1995). All these studies demonstrated that FTIR is a rapid and non-destructive technique and a powerful analytical tool for providing information about mid-infrared absorption spectra. Among the options, PAS has certain advantages because it requires no sample preparation. Moreover, it is quite sensitive, as found by Gordon et al. (1997), who distinguished the infrared spectra of corn without fungi contamination from that with only 3% Fusarium moniliforme fungi contamination. FTIR-PAS combined with chemometric analysis has been used to monitor the oxidation process in cooking oils and also in the fried product (Sivakesava and Irudayaraj, 2000). We combined FTIR-PAS with canonical discriminant analysis, for the first time to our knowledge, in order to evaluate the mid-infrared absorption spectra in different castes of the ant Ectatomma vizottoi Almeida, 1987. This ant is in the Ectatominae subfamily (Bolton, 2003), with species distributed around the world, but more abundantly in the tropics and subtropics (Kempf, 1972). We wanted to determine if this method can be used to analyze secondary amide (keratin) and cuticular hydrocarbon content, in order to distinguish males, workers and queens of social insects. MATERIAL AND METHODS Material collection The ants were collected from a single polygynous colony in an underground nest on the UEMS campus, Dourados (22°13’16"S/54°48’20"W), in central-western Brazil. Abdomens of 17 males, 5 queens and 14 workers of E. vizottoi were extracted, and placed in a vacuum dryer for 48 h in order to minimize adsorbed moisture, which could interfere in the spectrum. The FTIR-PAS was developed directly in the abdomen, because this is the part of the body where the cuticular hydrocarbons are the most concentrated (Cuvillier-Hot et al., 2001). Fourier transform-infrared photoacoustic spectroscopy The mid-infrared spectroscopy was carried out with a Thermo-Nicolet Nexus 670 spectrophotometer, combined with a Photoacoustic detector (MTEC-300). This measurement is based on a photoacoustic effect caused when an infrared radiance impinges on a sample surface in a sealed environment, the so-called photoacoustic cell (Rosencwaig, 1980). Due to sample absorption and consequently to the non-radiative de-excitation process of the modulated infrared beam, thermal waves are created and propagate to the sensitive microphone in the photoacoustic cell; these waves are transformed into a spectrum by A/D conversion. The spectrophotometer was purged with pure nitrogen gas in order to eliminate CO2 and water vapor during the experiment. The photoacoustic cell was also purged with helium throughout acquisition. Because the abdomens of queens, workers, and males have different forms and volumes, it is difficult to develop comparative measurements with the PAS because of the dependence of the PAS signal on the volume of the sample. Therefore, we did not use this methodology to analyze the spectra. Prior to acquisition of the abdomen spectra, carbon black was used as a reference sample. Spectra were obtained between 4000 and 400 cm-1, with 8 cm-1 resolution and 64 scans for each sample. The data were processed with Omnic Software. Statistical analysis In order to quantify the differences in keratin and cuticular hydrocarbon composition among the ant castes, we carried out a canonical discriminant analysis on the spectra obtained, using castes as factor and peak intensity as response variables. The keratin and hydrocarbon peak intensities were normalized by their intensity at 2000 cm-1. A stepwise procedure was utilized to obtain a minimum model predicting caste differentiation. This method was utilized to find the linear combinations of variables that maximize the probability of correctly assigning observations to their pre-determined groups (Quinn and Keough, 2005). RESULTS AND DISCUSSION Figure 1 shows the average FTIR-PAS spectra of abdomens for E. vizottoi queens, workers and males. Eighteen functional groups between 4000 and 400 cm-1 were identified, which are related to the keratin and hydrocarbons present in the cuticle. These peaks are listed in Table 1 together with their wavenumbers and the corresponding vibration modes taken from published reports (Smith, 1999). The N-H bending vibration around 1523 cm-1 was an important group wavenumber; its intensity was almost as intense as C=O stretching at 1651 cm-1. Therefore, a combination of these lines could be used to diagnose keratin or secondary amides in the cuticular analyses. In addition to these, in-plane bending of N-H is also observed at around 3082 cm-1. This line can be easily identified when compared with C-H stretching bands between 2960 and 2870 cm-1, as it is broader. Another useful line for secondary amide identification is the C-N stretch (peak 11) centered at 1238 cm-1. This line appears lower than the N-H bend (peak 8), because there is a vibrational interaction between C-N stretch and N-H bend. This phenomenon can be explained considering that excitation of the N-H leads to partial excitation of the C-N bond. As a consequence of this vibrational interaction, we have a peak at 2634 cm-1, which appears by stealing intensity via Fermi resonance (Smith, 1999). This discrete peak is seen in Figure 1.
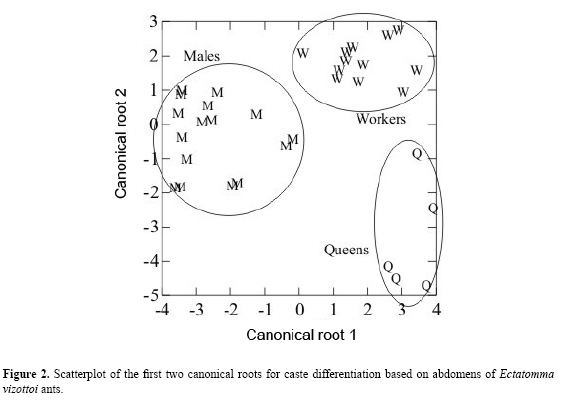
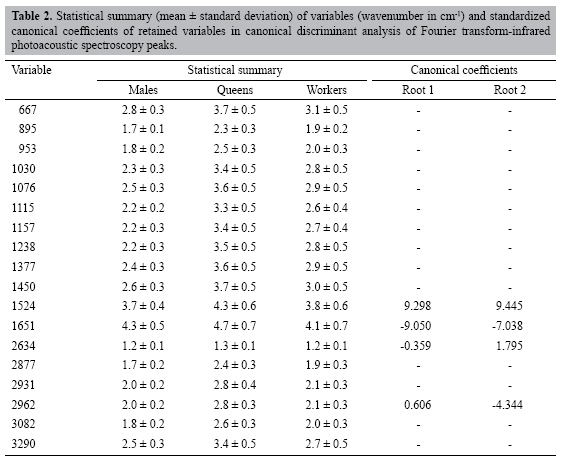
The results obtained from discriminant analysis based on the first two canonical root scores are plotted in Figure 2. The two main different groups were queens and males, with workers being closer to males. The keratin lines contributed to discriminate between queens and workers from males, which exhibited lower keratin concentrations. The 1524 cm-1 canonical root variable was higher than 1651 and 2634 cm-1 (see Figure 2 and Table 2). On the other hand, the 2962 cm-1 absorption line defines the queens’ position in the canonical root graph, indicating higher hydrocarbon concentrations than in males and workers. A similar relationship was also found in a recent study with mass spectrometer of the bee Melipona bicolor (Abdalla et al., 2003). The lower hydrocarbon content in males is related to their social function in the colony, because males do not need a well-defined identity, except for sexual identification.
Smith B (1999). Infrared spectral interpretation, a systematic approach. CRC Press, Boca Raton. | |