![]()
![]()
![]()
![]()
![]()
![]()
![]()
![]()
![]()
![]()
![]()
| Study of genetic divergence among wheat genotypes through random amplified polymorphic DNA
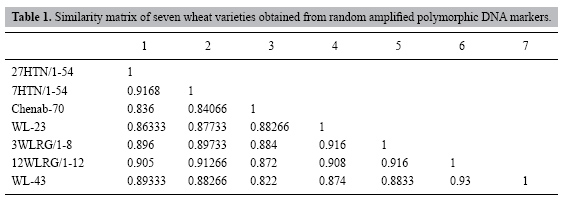
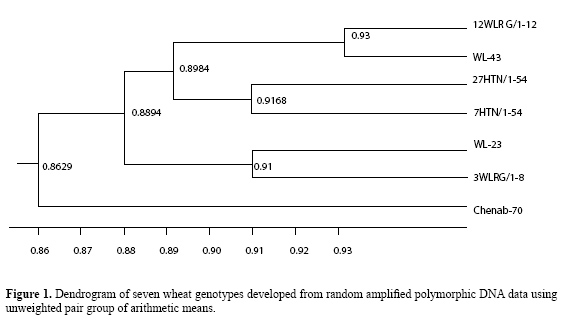
A. Iqbal, A.S. Khan, I.A. Khan, F.S. Awan, A. Ahmad and A.A. Khan Centre of Agricultural Biochemistry and Biotechnology, University of Agriculture Faisalabad, Pakistan Corresponding author: F.S. Awan E-mail: [email protected] Genet. Mol. Res. 6 (3): 476-481 (2007) Received July 31, 2006 Accepted June 5, 2007 Published August 7, 2007 ABSTRACT. The degree of genetic divergence was estimated in seven wheat genotypes, six exotic genotypes and one local variety, through random amplified polymorphic DNA methodology. A total of 112 DNA fragments were generated by the 15 random primers, with an average of about 7.4 bands per primer. Among the 112, 50 fragments showed polymorphism among the seven wheat genotypes. Nei and Li’s similarity matrix ranged from 86.2 to 93.0%, which indicated a narrow genetic base among the genotypes. The maximum similarity, 93.0%, was observed between 12WLRG/1-12 and WL-43. The local variety, Chenab-70, showed the lowest similarity with the exotic types. We conclude that random amplified polymorphic DNA analysis can be used for the characterization and grouping of wheat genotypes; these results will be helpful in our wheat breeding program. Key words: Genetic diversity, RAPD, Triticum aestivum L. INTRODUCTION Being a staple food, wheat occupies an important place in the crop husbandry of Pakistan. Although wheat production in Pakistan has been better during recent years than it was previously, continued improvement in productivity is highly desirable because of increasing demand by the still-growing human population. However, during the last few years, yield improvement in wheat varieties has not been substantial; the narrow genetic base of the germplasm in use has been considered the main reason. Knowledge of diversity patterns allows plant breeders to better understand the evolutionary relationships among accessions, to sample germplasm in a more systematic fashion, and to develop strategies to incorporate useful diversity in their breeding programs (Bretting and Widrlechner, 1995). Information about genetic diversity and relatedness in the available germplasm and among elite breeding material is a fundamental element in plant breeding. The future of our breeding program depends upon the availability of genetic variability to increase productivity. Traditionally, assessment of genetic diversity has been based on differences in morphological and agronomic traits or on pedigree information for the different crops (Gizlice et al., 1996; Sneller et al., 1997; Bernard et al., 1998). Recently, restriction fragment length polymorphisms and isozyme markers have been used for diversity studies and for genetic mapping of these crop species (Trujillo et al., 1995; Paull et al., 1998). But their use has remained limited, as they revealed low levels of polymorphism and isozyme expression was found to be highly influenced by environmental conditions (Hernendez et al., 2001). However, PCR-based DNA marker techniques seem to provide the means for generating useful information on polymorphism, genetic relatedness and diversity. The PCR-based random amplified polymorphic DNA (RAPD) markers are dominant markers and are extensively used in genetic mapping (Chalmers et al., 2001) and for the identification of markers linked with useful traits (Bai et al., 2003). Due to its technical simplicity and speed, RAPD methodology has been used for diversity analyses in several crops (Zenglu and Randall, 2001). Wheat is characterized by a large genome size (approximately 17,000 Mb) and little or no sequence information is available for the wheat genome. We made an RAPD analysis of seven genotypes of wheat to estimate their genetic diversity and relatedness and to compare the exotic genotypes with the local variety. The information gathered will be helpful for our breeding programs. MATERIAL AND METHODS The plant material The plant material used in the study consisted of seven genotypes of wheat: 27HTN/1-54, 7HTN/1-54, 3WLRG/1-8, 12WLRG/1-2, WL-23, WL-43, and Chenab-70. All genotypes were planted in pots in a growth chamber. DNA extraction The wheat genotypes were grown in plastic containers (250 mL); 0.2-0.3 g leaf tissues were obtained from the 6-day-old seedlings. After being cut into small pieces, the weighed tissues were immediately transferred into zippered plastic bags containing 1.5 mL cetyl trimethyl ammonium bromide. The leaf material was completely homogenized with a hand roller. After incubation, at 65oC for 30 min, the homogenized leaf tissues were transferred to two 1.5-mL Eppendorf tubes. Equal volumes (0.75 mL) of chloroform and isoamylalcohol were added and the tubes were inverted vertically 5-10 times, followed by centrifugation at 13,000 rpm for 10 min. After centrifugation, 800 µL of supernatant was transferred from both tubes to another 1.5-mL Eppendorf tube. Then, approximately 700 µL isopropanol was added to the supernatant (800 µL) and mixed by inverting the tube about 10 times. The DNA was pelleted and washed and resuspended in 150 µL 0.1X Tris EDTA. The concentration of DNA was measured at 260 nm in a spectrophotometer (CECIL CE 2021 2000 Series). The quality of DNA was checked by running 5 µL DNA on a 0.8% agarose gel prepared in 0.5X Tris borate EDTA buffer. The DNA samples that produced undefined smears on the gel were rejected. RAPD analyses DNA concentration in the working solution of approximately 15 ng/µL in d3H2O was confirmed by spectrophotometer. For RAPD analysis (Williams et al., 1990), concentration of genomic DNA, 10X PCR buffer with (NH4)2SO4, MgCl2, dNTPs (dATP, dCTP, dGTP, dTTP), 10 mer random primer and Taq DNA polymerase were optimized. The 10-base oligonucleotide primers obtained from GeneLink company (USA) were used for the amplification of the genomic DNA. Taq polymerase buffer, MgCl2, dNTPs, and gelatin were purchased from Fermentas (Italy). DNA amplification reactions were performed in a thermal cycler (Eppendorf AG No. 5333 00839). The PCR profile was: one cycle of 94°C for 5 min, 40 cycles of 94°C for 1 min, 36°C for 1 min, and 72°C for 2 min, and a final extension for 10 min at 72°C. Analyses of RAPD data The RAPD fragments were analyzed by electrophoresis on 1.2% agarose gels with ethidium bromide (10 ng/100 mL of agarose solution in Tris borate EDTA buffer). The bands were counted by starting from the top of the lanes to the bottom. All visible and unambiguously scorable fragments amplified by the primers were scored under the heading of total scorable fragments. Amplification profiles of the seven genotypes were compared with each other, and bands of DNA fragments were scored as present or absent. The data of the primers were used to estimate genetic similarity (Table 1) on the basis of number of shared amplification products (Nei and Li, 1979). The equation used was: No. of shared amplification products = 2 x (No. of common bands between any two lanes)/(Total No. of bands in the same two lanes). Genetic relationship among the genotypes was estimated with the dendrogram (Figure 1) constructed using unweighted pair group of arithmetic means (Sneath and Sokal, 1973). RESULTS AND DISCUSSION DNA of seven varieties of wheat was amplified with 15 different random primers, i.e., A2, A3, A5, A12, A13, A14, A15, A16, A18, A19, A20, B3, B16, B17, and B20. A total of 112 DNA fragments were generated by the 15 primers, with an average of about 7.4 bands per primer (range = 3-11). The number and size of the DNA fragments were strictly dependent upon the sequence of the primer. Reactions were repeated from two to three times to check the consistency of the amplified products; only easily resolved and bright DNA bands were counted. All the genotypes differed, based on their amplification profile with these 112 DNA bands. Fifty fragments were polymorphic (45%) in these seven wheat varieties. Ten individual plants of each genotype were tested separately; all showed similar banding patterns, indicating that the genotypes were highly homozygous. All the seven wheat varieties could be identified with a single primer. These results suggest that RAPD markers provided substantial information for the identification of wheat genotypes. Among the seven wheat genotypes, 3WLRG/1-8 produced the largest number of DNA-amplified fragments (110), while the smallest number (93) was produced by Chenab-70.
|
|