![]()
![]()
![]()
![]()
![]()
![]()
![]()
![]()
![]()
![]()
![]()
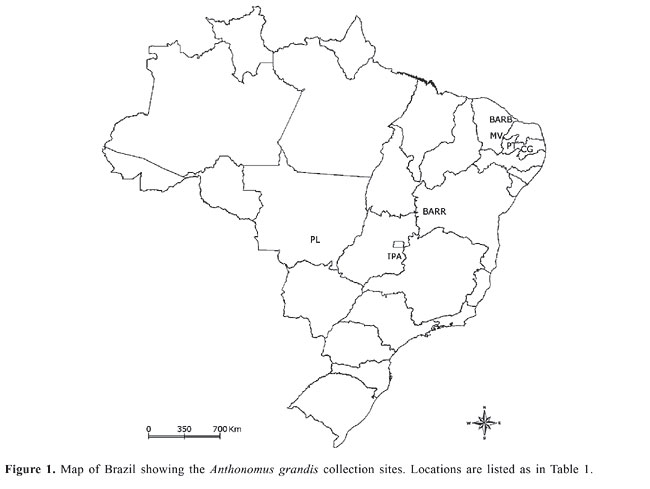
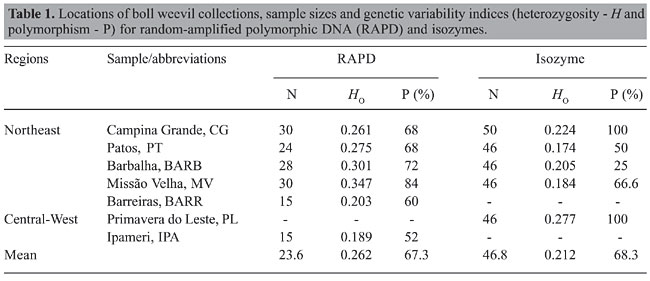
ABSTRACT. Twenty-five RAPD loci and 6 isozyme loci were studied to characterize the genetic variability of natural populations of Anthonomus grandis from two agroecosystems of Brazil. The random-amplified polymorphic DNA data disclosed a polymorphism that varied from 52 to 84% and a heterozygosity of 0.189 to 0.347. The index of genetic differentiation (GST) among the six populations was 0.258. The analysis of isozymes showed a polymorphism and a heterozygosity ranging from 25 to 100% and 0.174 to 0.277, respectively. The genetic differentiation (FST) among the populations obtained by isozyme data was 0.544. It was possible to observe rare alleles in the populations from the Northeast region. The markers examined allowed us to distinguish populations from large-scale, intensive farming region (cotton belts) versus populations from areas of small-scale farming. Key words: Boll weevil, Variability, RAPD, Isozymes INTRODUCTION The boll weevil Anthonomus grandis Boheman is the main pest of the cotton industry worldwide. Damage to cultivated cotton caused by this insect was first reported in 1880 for the State of Cohahuila in Mexico (Burke et al., 1986). In South America, the boll weevil was first observed in Venezuela (1949). Of all the countries on the American continent, Brazil was the last to report the presence of A. grandis, where in February 1983, the pest was reported to occur on cotton plantations in Santa Bárbara do Oeste, São Paulo State (Lozada et al., 1987). Currently, the boll weevil is present in almost all cotton production regions throughout Brazil. There is a great diversity of environments with very different climate and soils between these regions, and the level of technology and agricultural inputs used in these areas is also quite different, from very low by small-scale farmers to very high by large-scale farmers (Fontes et al., 2006). The control programs in place in the three largest production areas, located in the States of Mato Grosso, Goiás (Central-West Region) and Bahia (Northeast), have not achieved eradication but have kept A. grandis populations at a low density. However, in the regions where small-scale farms prevail, the populations of the boll weevil show higher levels, causing economic damage, mainly due to the lack of efficient control programs. The characterization of genetic variability in crop pest populations and the factors that maintain this variability as well, is very important for the elaboration of more effective control programs. In the last twenty years, molecular markers have been shown to be great tools for studies of population genetics, evolutionary biology, taxonomy and conservation biology, allowing the analysis of the diversity and genetic differentiation of natural populations (Van Oosterhout et al., 2004). Studies of genetic diversity in A. grandis are scarce and restricted to North and Central American populations. The first genetic studies of A. grandis populations used isozymes as molecular markers (Bancroft and Jones, 1977; Biggers and Bancroft, 1977; Bartlett, 1981; Bartlett et al., 1983; Terranova and North, 1985; Terranova et al., 1991). Bartlett (1981) examined 12 enzyme loci and concluded that A. grandis thurberiae Pierce, A. grandis Boheman and the boll weevil of Arizona constituted three distinct gene pools with restricted gene flow among them. Studies of genetic variability in A. grandis using DNA markers have been carried out basically with mtDNA-RFLP (restriction fragment length polymorphism of mitochondrial DNA) and RAPD (random-amplified polymorphic DNA), in molecular systematic approaches (Roehrdanz and North, 1992; Roehrdanz, 2001), and with regard to the dispersion and genetic structure of populations (Scataglini et al., 2000; Kim and Sappington, 2004a,b). Scataglini et al. (2000) using RAPDs examined gene flow and genetic structure in nine populations of A. grandis from South and North America. The data obtained showed great similarity between the populations of Porto Iguaçu (Argentina) and Tecomán (Mexico), suggesting an ancestral link between the two populations. Despite the almost totally accepted idea of later accidental introduction, the authors proposed the natural occurrence of A. grandis in South America before the extensive cultivation of cotton on the American continent. Kim and Sappington (2004b) used RAPDs to study the genetic structure of populations of boll weevil from the United States and Mexico. The results revealed the occurrence of limited gene flow between the populations of the central, eastern and western regions of the southern United States. However, the gene flow between populations from the same regions separated by distances less than 300 km was relatively constant. The main goal of the present study was to characterize for the first time the genetic diversity of the A. grandis populations in five Brazilian States: Paraíba, Ceará, Mato Grosso, Bahia, and Goiás, using isozymes and RAPD. MATERIAL AND METHODS Sample collection Cotton bolls and flower buds with boll weevil damage were collected between 2002 and 2005 from seven locations in five States of Brazil (Figure 1): 1) Campina Grande (CG, 35° 56’ W, 7° 11’ S) and Patos (PT, 38° 11’ W, 7° 18’ S) in Paraíba - PB; 2) Barbalha (BARB, 39° 18’ W, 7° 18’ S) and Missão Velha (MV, 39° 11’ W, 7° 11’ S) in Ceará - CE; 3) Barreiras (BARR, 44° 56’ W, 12° 11’ S) in Bahia - BA; 4) Primavera do Leste (PL, 54° 22’ W, 15° 37’ S) in Mato Grosso - MT, and 5) Ipameri (IPA, 48° 11’ W, 17° 41’ S) in Goiás - GO. The populations from Goiás, Mato Grosso and Bahia were collected in regions of “Cerrado”, the Brazilian savanna. Whereas, populations from Paraíba and Ceará are enclosed in an ecosystem called Caatinga, which is the Brazilian semiarid vegetation. The former is characterized by a large-scale production system and in the second the majority of farmers are small holders on predominantly family holdings (Fontes et al., 2006). The larvae and adults obtained were stored at -20°C until allozyme analyses and DNA extraction. Sample sizes are shown in Table 1.
DNA extraction and RAPD Total DNA was isolated from individual heads of A. grandis. Each head was homogenized in 500 µL of lysis buffer (0.4 M NaCl, 2 mM EDTA, 10 mM Tris-HCl, pH 8.0) containing proteinase K (10 mg/mL) and 1.5% sodium dodecyl sulfate. Homogenates were incubated at 65°C overnight and 420 µL 5 M NaCl was added to the sample. The homogenates were vortexed for approximately 1 min followed by centrifugation at 14,000 rpm for 20 min at 4°C. An equal volume of isopropanol was added to the samples to precipitate the DNA from the supernatant and the microtubes were kept at -20°C for at least 1 h. DNA was then pelleted by centrifuging at 14,000 rpm at 4°C for 20 min. The pellet was washed with 70% ethanol, vacuum-dried and resuspended in 200 µL of ultra-pure water (Gibco). The quality and amount of DNA were obtained by comparing samples to a low-DNA mass ladder on 0.8% agarose gels. About 20 ng DNA was used as template for PCR amplification as follows: 10 mM Tris-HCl, pH 9.0, 50 mM KCl, 1.5 mM MgCl2, 2 U of Invitrogen Taq DNa polymerase, 0.2 µM of each deoxynucleotide, and 400 pmol of primer, in a final volume of 25 µL. Sixty primers (Operon®) were tested and 3 were selected based on their reproducibility. The selected primers were OPA8 (5’-GTA CGT AGG-3’), OPA18 (5’-AGG TGA CCG T-3’) and OPC19 (5’-GTT GCC AGC C-3’). The amplification program consisted of 40 cycles of the following: 94°C for 1 min, 35°C for 1 min, 72°C for 2 min and a final cycle at 72°C for 10 min. The PCR products were analyzed on 1% agarose gels. Allozyme electrophoresis Individual larvae of A. grandis were homogenized in microtubes in 500 µL of cold water using a glass rod. Pieces of Whatman No. 3 filter paper were used to absorb protein homogenates and inserted in penetrose 30 cornstarch gels (Refinações de Milho Brasil) with a final concentration of 13% cornstarch and 5% sucrose. Horizontal electrophoresis was conducted at 4°C overnight according to Alfenas et al. (1991). Penetrose gels were prepared using citric acid buffer (0.04 M citric acid and morpholine, pH 7.1). We examined 14 enzyme systems: catalase (Cat, EC 1.11.1.6), glucose dehydrogenase (Gludh, EC 1.1.1.47), isocitrate dehydrogenase (Idh, EC 1.1.1.42), glutamate dehydrogenase (Gdh, EC 1.4.1.3), leucine aminopeptidase (Lap, EC 3.4.11.1), mannitol dehydrogenase (Madh, EC 1.1.1.67), peroxidase (Po, EC 1.11.1.7), superoxide dismutase (Sod, EC 1.15.1.1), alcohol dehydrogenase (Adh, EC 1.1.1.1), alanine aminopeptidase (Aap, EC 3.4.11.14), nicotinamide adenine dinucleotide dehydrogenase (Nadhdh, EC 1.6.99.3), esterase (Est, EC 3.1.1.1), malic enzyme (Me, EC 1.1.1.40), and malate dehydrogenase (Mdh, EC 1.1.1.37). Statistical analysis RAPD marker analysis was based on the following assumptions: 1) RAPD alleles segregate in a Mendelian fashion; 2) populations are in Hardy-Weinberg equilibrium; 3) bands that co-migrate are homologous, and 4) alleles that are not amplified segregate as recessive markers. Loci were scored as present (1) or absent (0), without considering band intensity. Based on these assumptions and using a binary matrix, we estimated gene frequencies, percent polymorphic loci and mean heterozygosity using the Tools for Population Genetic Analyses - TFPGA 1.3 program (Miller, 1997). The estimates of genetic distance (Nei, 1972) and the population differentiation parameters (GST) according to McDermott and McDonald (1993) were carried out using POPGENE version 1.32 (Yeh and Boyle, 1997). Allozymes were numbered according Tabachnick and Powell (1979), where loci and alleles are designated by numbers. Genetic variability parameters (observed heterozygosity mean and percentage of polymorphic loci) and unbiased genetic distances (Nei, 1972) between populations were estimated using GENETIX 4.01 (Belkhir et al., 2001). The genetic differentiation between populations was estimated using the inbreeding index q (FST) (Weir and Cockerham, 1984) using the FSTAT 2.9.3 program (Goudet, 2001). Gene flow rates were determined based on the following formula: Nm = (1/FST - 1)/4. Genetic distances between the populations obtained by RAPD and isozymes were summarized in a dendrogram constructed using the neighbor-joining method by MEGA 3 (Kumar et al., 2004), based on the genetic distance matrix (Nei, 1972). Significance values for FST and GST were estimated nonparametrically with an exact test using the TFPGA 1.3 program (Miller, 1997). RESULTS RAPD The selected primers OPA8, OPA18 and OPC19 generated 8, 8 and 9 bands, respectively, making it possible to identify fragments between 320 and 1700 bp. Two fragments of 1600 and 1700 bp generated by primer OPA18 and the fragments of 1100, 1300 and 1400 bp amplified by primer OPA8 were observed exclusively in the northeast populations except for BARR. The proportion of polymorphic loci varied from 52 to 84%. Heterozygosity ranged from 0.189 to 0.347 (Table 1), with an average of 0.262, disclosing a considerable genetic variation in the populations. The general differentiation among the six populations corresponded to a GST of 0.258 (P < 0.05) and Nm = 0.72. The populations from Paraíba and Ceará showed high (GST = 0.242; Nm = 0.78) and moderate (GST = 0.150; Nm = 1.42) genetic differences, respectively. With the objective of investigating the differentiation between the states, the subpopulations of Paraíba and Ceará were grouped as one population, according to the hierarchical categories. The genetic differentiation between the two States corresponded to a GST of 0.013 (P < 0.05).
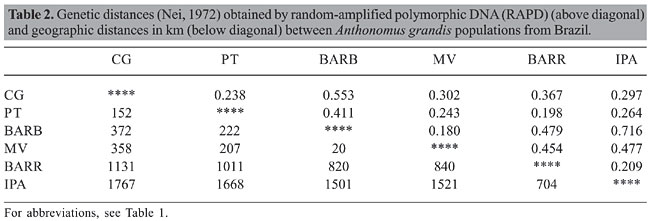
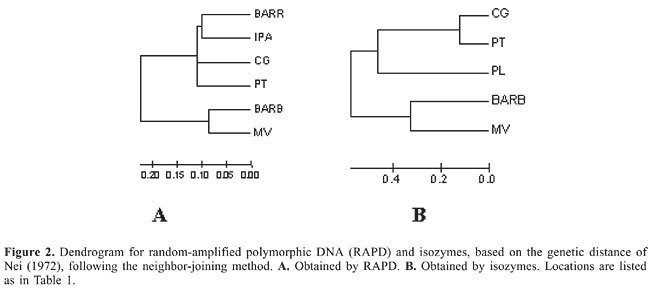
The genetic distance among the populations varied from 0.180 to 0.716 (Table 2). The dendrogram obtained by the neighbor-joining method (Figure 2A) based on the genetic distance of Nei (1972) demonstrated two distinct groups, one formed by the populations of Ceará and another constituted from populations of Bahia, Goiás and Paraíba.
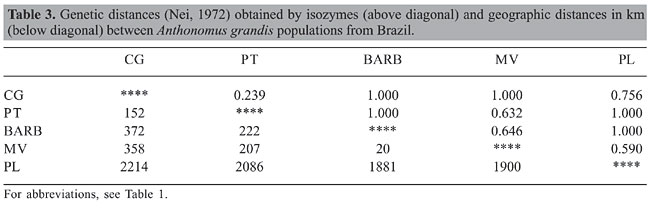
Isozymes Eight of 14 enzyme systems initially tested showed no activity (CAT, GLUDH, GDH, LAP, MADH, NADHDH, ADH, and AAP) and one (SOD) produced profiles that were difficult to interpret due to weak enzyme activity or proximity of the bands and were therefore not considered in this analysis. The 5 enzyme systems chosen for analysis (ME, EST, MDH, PO, and IDH) led to the identification of 11 possible loci. Est-1, Est-3, Est-4, and Po-2 showed diagnostic alleles for the PL population, and the locus Mdh-2 was found in all populations except that of CG population. These apparent diagnostic loci were not considered in the determination of diversity and genetic structure. The six loci used, Est-2, Po-1, Mdh-1, Idh-1, Idh-2, and Me-1, were polymorphic in at least one population (considering the 95% criterion, where the frequency of the most common allele does not exceed 95%). The Hardy-Weinberg equilibrium was rejected (P < 0.05) in three loci, Po-1 in the CG population, Idh-1 in the MV population and Mdh-1 in the BARB population. The observed heterozygosity ranged from 0.174 in PT to 0.277 in PL, and the average was 0.212. Polymorphism varied from 25 to 100% (Table 1). The general differentiation (FST) among the five populations was 0.544 (P < 0.05) and Nm = 0.210. The locus Po-1 (FST = 0.878) had the greatest influence on FST values, and Est-2 (FST = 0.064) had the least. The FST varied from 0.025 (Nm = 9.69) for PT and CG to 0.841 (Nm = 0.05) for BARB and PL. The Nei (1972) genetic distance ranged from 0.239 to 1.000 (Table 3). The dendrogram obtained by the neighbor-joining method (Figure 2B), disclosed the presence of two distinct groups, one formed by the Ceará populations and another one by the Paraíba and Mato Grosso populations.
DISCUSSION This study represents the first evaluation of the genetic diversity of the boll weevil carried out in populations from different cotton-growing areas of Brazil. The profiles for the isozymes of the six loci were equal to those observed by Terranova and North (1985) in colonies of A. grandis from the United States. The four loci of esterases observed by Biggers and Bancroft (1977) in A. grandis collected from cotton fields in Tennessee, USA, and by Bancroft and Jones (1977) using frass from laboratory colonies of A. grandis, were observed only in the PL population. Est-1, Est-2 and Est-3 loci were diagnostic for this population. According to Bartlett (1981), differences in enzyme activity for the isozyme loci among populations could indicate different physiological conditions. Local environmental factors may also result in different expression of isozymes. These qualitative changes have been noted in other organisms. Another hypothesis could be a different origin of this population. However, the loss of enzyme activity due to a storage effect could also contribute to the occurrence of these differences. Low values of heterozygosity (Table 1) are expected in populations of a recently introduced invasive insect such as the boll weevil, which was probably brought into Brazil accidentally. A. grandis was first detected in Brazil in February 1983, in the State of São Paulo, located in the meridian region. In the same year it became established in Northeast region with high-infestation levels (Burke, 1986; DeGrande, 1991). This situation changed dramatically the cotton production in that region, which 20 years ago produced a significant part of the cotton grown in the world (Fontes et al., 2006). RAPD data showed the lowest value of genetic diversity in the populations of BARR and IPA (Table 1), placed in the Cerrado. The genetic diversity of the boll weevil populations from this region is influenced annually by the bottleneck effect mainly caused by the lack of host plants during the period between harvests or by the mass application of insecticide in the cotton belts as a control method. It forms an extensive favorable homogeneous environment for insect proliferation only during the cotton-growing season. However, during the period between harvests, reproduction is restricted to the few stands of feral cotton growing on the edges of the cultivated fields. These factors might be responsible for the maintenance of this low-genetic diversity at these locations. On the other hand, the high level of genetic diversity and the presence of diagnostic alleles among northeaster populations detected by RAPD, suggest a large and independent introduction into the Northeast region, and the populations from BARR, IPA and PL probably originated from these populations or from São Paulo. Curiously, these data contrast with those obtained by isozymes, for which showed a higher value of genetic diversity in PL population. Unfortunately, data for BARR and IPA populations are missing, which avoid us to compare both ecosystems. The northeaster populations were collected from small-scale farm areas. These regions are in a very similar ecosystem, and they are discontinuous among the region planters, forming islands of cotton in the Brazilian northeast. Also, there is no integrated program aimed at handling boll weevil infestations, nor there is intensive use of chemical pesticides, when compared with the Cerrado region. The absence of control programs in areas of small-scale farming along with the presence of edge shelters, which lodge the individuals from one year to the next, serving as a reservoir for ancestral genetic variability, favors the maintenance of an intense gene flow among these populations throughout the year and limits the genetic differentiation among them. Different levels of genetic diversity between boll weevil populations from different geographic regions were also observed in North America. Microsatellite data showed high levels of genetic diversity in southern populations while northern populations revealed low genetic diversity (Kim and Sappington, 2006). These results were in agreement with RAPD and mtDNA data reported previously (Kim and Sappington, 2004a,b). The genetic differentiation evidenced by RAPD (GST = 0.258; Nm = 0.72) and isozymes (FST = 0.544; Nm = 0.210) disclosed that Brazilian populations of A. grandis show heightened genetic structuring. The index of genetic differentiation observed by isozymes was found to be almost two times higher than that obtained by RAPD. This difference may be influenced by the enzyme polymorphism caused in response to environment conditions. The values of genetic differentiation obtained by RAPD disclosed that genetic differentiation is higher among the subpopulations (GST = 0.258) intra-state than that detected between the populations from the States of Paraíba and Ceará, where genetic differentiation was moderate (GST = 0.014). These results suggest that, as the settling of this species occurred recently, the local process of differentiation can be well evidenced; however, there has still not been enough time for evolutionary factors modifying the genetic composition of the subpopulations. Studies with polymorphic markers (microsatellites and mtDNA) are being carried out in our laboratory. These data will supply more detailed information about the origin of these populations and the routes of dispersion of A. grandis in Brazil, which will help in developing measures to control this plague more effectively. ACKNOWLEDGMENTS We thank Cibele Sousa and Airton Belo for their technical assistance. We are grateful to Ramon Vasconcelos, João Batista, Dr. Miranda and all the colleagues who sent us weevils from across the country. Thanks go to CNPq (Proc. 474070/2003), CAPES, FIOCRUZ, Embrapa Algodão, Zoology Department (CCB/UFPE), and FIALGO for grants, scholarships and financial support in regard to this study. REFERENCES Alfenas AC, Peters I, Brune W and Passador GC (1991). Eletroforese de proteínas e isoenzimas de fungos e essências florestais. Universidade Federal de Viçosa, Viçosa. Bancroft HR and Jones BR (1977). Genotypes of esterase II determined from frass of Anthonomus grandis Boh. (Coleoptera, Curculionidae). Biochem. Genet. 15: 1175-1180. Bartlett AC (1981). Isozyme polymorphisms in boll weevil and Thurberia weevil from Arizona. Ann. Entomol. Soc. Am. 74: 359-362. Bartlett AC, Randall WC and May JE (1983). Allozyme variation among populations of boll weevil in Arizona and Mexico. Southwest. Entomol. 8: 118-130. Belkhir K, Borsa P, Chikhi L, Raufaste N, et al. (2001). Genetix 4.02, Logiciel Sous Windows TM Pour la Génétique des Populations. Laboratoire Génome, Populations, Interactions, CNRS UMR 5000. University of Montpellier II, France. Biggers CJ and Bancroft HR (1977). Esterases of laboratory-reared and field-collected cotton boll weevils, Anthonomus grandis Boh.: polymorphism of adult esterases and formal genetics of esterase II. Biochem. Genet. 15: 227-233. Burke HR (1986). Situação taxonômica do bicudo do algodoeiro no Brasil e em outras áreas da América do Norte e do Sul. In: O bicudo do algodoeiro (Barbosa S, Lukefahr MJ and Braga Sobrinho R, eds.). EMBRAPA-DDT, Brasília, 89-134. Burke HR, Clark WE, Cate JR and Fryxell PA (1986). Origin and dispersal of the boll weevil. Bull. Entomol. Soc. Am. 32: 228-238. DeGrande PE (1991). Aspectos biológicos do bicudo. In: Bicudo do algodoeiro: manejo integrado. UFMS/EMBRAPA-UEPAE, Dourados, 11-27. Fontes EM, Ramalho FS, Underwood E, Barroso PA, et al. (2006). The cotton agricultural context in Brazil. In: Environmental risk assessment of genetically modified organisms (Hilbeck A, Andow DA and Fontes EM, eds.). CABI Publishing, Oxfordshire, 372. Goudet J (2001). FSTAT, a program to estimate and test gene diversities and fixation indices. Version 2.9.3. Available from http://www2.unil.ch/popgen/softwares/fstat.htm. Kim KS and Sappington TW (2004a). Boll weevil (Anthonomus grandis Boheman) (Coleoptera: Curculionidae) dispersal in the southern United States: evidence from mitochondrial DNA variation. Mol. Ecol. Evol. 33: 457-470. Kim KS and Sappington TW (2004b). Genetic structuring of boll weevil populations in the US based on RAPD markers. Insect Mol. Biol. 13: 293-303. Kim KS and Sappington TW (2006). Molecular genetic variation of boll weevil populations in North America estimated with microsatellites: implications for patterns of dispersal. Genetica 127: 143-161. Kumar S, Tamura K and Nei M (2004). MEGA3: integrated software for molecular evolutionary genetics analysis and sequence alignment. Brief Bioinform. 5: 150-163. Lozada RM, Alvarez LA and Whitcomb WH (1987). El picudo mejicano del algodonero, Anthonomus grandis Boh: el desafio para la producción algodonera en el Paraguay. Ministerio de Agricultura y Ganadeiro, Paraguay. Serie Publicacion miscelanea, 18. McDermott JM and McDonald BA (1993). Gene flow in plant pathosystems. Annu. Rev. Phytopathol. 31: 353-373. Miller MP (1997). Tools for populations genetic analyses (TFPGA) 1.3. A windows program for analysis of allozyme and molecular populations genetic data. [Computer software distributed by author]. Nei M (1972). Genetic distance between populations. Am. Nat. 106: 283-292. Roehrdanz RL (2001). Genetic differentiation of southeastern boll weevil and Thurberia weevil populations of Anthonomus grandis (Coleoptera: Curculionidae) using mitochondrial DNA. Genetics 94: 928-935. Roehrdanz RL and North DT (1992). Mitochondrial DNA restriction fragment variation and biosystematics of the boll weevil, Anthonomus grandis. Southwest. Entomol. 17: 101-108. Scataglini MA, Confalonieri VA and Lanteri AA (2000). Dispersal of the cotton boll weevil (Coleoptera: Curculionidae) in South America: evidence of RAPD analysis. Genetica 108: 127-136. Tabachnick WJ and Powell JR (1979). A world-wide survey of genetic variation in the yellow fever mosquito, Aedes aegypti. Genet. Res. 34: 215-229. Terranova AC and North DT (1985). Inheritance of allozyme in the boll weevil (Coleoptera: Curculionidae). Ann. Entomol. Soc. Am. 78: 166-171. Terranova AC, Jones RG and Bartlett AC (1991). An allozyme study of the laboratory boll weevil and its influence on some southeastern populations. Southwest. Entomol. 16: 1-11. Van Oosterhout C, Van Heuven MK and Brakefield PM (2004). On the neutrality of molecular genetic markers: pedigree analysis of genetic variation in fragmented populations. Mol. Ecol. 13: 1025-1034. Weir BS and Cockerham CC (1984). Estimating F-statistics for the analysis of population structure. Evolution 38: 1358-1370. Yeh FC and Boyle TJB (1997). Population genetic analysis of co-dominant and dominant markers and quantitative traits. Belg. J. Bot. 129: 157. |
|