![]()
![]()
![]()
![]()
![]()
![]()
![]()
![]()
![]()
![]()
![]()
ABSTRACT. The large pimelodid, Brachyplatystoma rousseauxii, is one of the two most important catfish species for the fisheries in the Amazon. It is captured by commercial and artisanal fishing fleets in at least five Amazonian countries, at fishing grounds more than 5000 km apart. Current evidence suggests a complex life cycle that includes the longest reproductive migration known for a freshwater fish species. Experimental fisheries have pointed to a decrease in yield in the Western Amazon. However, reliable information about the capture and status of this fishery resource is still nonexistent, and no study has ever addressed its genetic diversity. We sequenced the entire D-loop of 45 individuals of B. rousseauxii, fifteen from each of three different fishing locations along the main channel of the Solimões-Amazonas System covering a distance of around 2200 km. Results of phylogenetic analyses, molecular diversity estimations, analysis of molecular variance, and nested clade analysis, together show that there is no genetic segregation associated with location in the main channel, as one would expect for a migratory species. However, the significant decrease found in genetic diversity towards the western part of the Amazon could be explained by a non-random choice of tributary to spawn. It is possible that the genetic diversity of the migrating schools decreases towards the west because portions of the species’ genetic diversity are being “captured” by the different effluents, as the fish migrates to spawn in the headwaters. Like the salmon in North America, B. rousseauxii may be returning to their home tributary to spawn. Key words: Siluriformes, Brachyplatystoma, Phylogeography, Amazon, Fish homing, Conservation INTRODUCTION The Amazon, with a geographical area of about 6,500,000 km2, holds an incomparable network of river and water habitats which harbors the richest icthyofauna of the planet. Fish represent not only a very accessible source of protein, but also an important source of income for the Amazonians, especially for families in the lower socio-economic range. In fact, fishing has always been a major economic activity in the entire region, but for most of the commercially important fish groups we still do not know the basic parameters of their biology or the status of their stocks. Finding the point where the fishing activity becomes sustainable is a major goal still to be accomplished, and modern molecular techniques can definitely contribute to such a complex task. The large majority of the fish commercially captured for food in the Amazon falls within a group of approximately 30 species, which are divided into two major classes, based on local cultural standards: the scaled fish (essentially the representatives of orders Characiformes, Osteoglossiformes, Perciformes, and Clupeiformes) and the scaleless or “leathered” fish (the large catfish of the order Siluriformes). Considering the latter, 95% of the capture is centered over around five species of the family Pimelodidae and more than 60% of that is made up by only two pimelodids: Brachyplatystoma rousseauxii, regionally known as dourada, and B. vaillantii, known as piramutaba (Barthem and Goulding, 1997). Understanding the life cycle and population parameters of these two species is crucial to assure their conservation. B. rousseauxii has been among the two most important and intensively captured catfish for decades along the main channel of the Solimões-Amazonas River System1 (SAS), at fishing grounds distributed over five countries, more than 5000 km apart (Barthem and Goulding, 1997) (Figure 1). The peak of fishing activity at most of the locations along this extensive geographical area is seasonal and associated with a complex, and not completely understood, life cycle. This cycle, which is also found in other large pimelodids, apparently includes the longest reproductive migration known for a freshwater fish species.
In 1998, a study comparing the capture of B. rousseauxii in Belém to previous years (JICA/MPEG/IBAMA, 1998) pointed to overfishing, based on the reduction of the yield in that region. More recently, Alonso (2002) confirmed the overfishing of dourada in the SAS, reinforcing the need for studies focused on this species. The same situation appears to be applicable for other large pimelodidae such as B. vaillantii (Barthem and Petrere, 1995) and B. filamentosum, the largest pimelodidae in the Amazon (Petrere et al., 2004). REPRODUCTIVE MIGRATION OF BRACHYPLATYSTOMA ROUSSEAUXII A model for the life cycle of B. rousseauxii, and other pimelodid catfishes, was proposed by Barthem and Goulding (1997), based on an extensive review of the available evidence complemented by the analyses of several thousands of samples obtained from 25 rivers of the Amazon Basin. For instance, the average size of capture at the main fishing locations along the SAS increases towards the west, with the large mature fish being only found in the Western Amazon. Furthermore, not a single mature individual was ever registered east of Manaus, regardless of the tremendous fishing activity over the last couple of decades. According to the authors, schools of immature adults and pre-adults of “dourada” concentrate in the lower portion of the Amazon River, near the estuary. Between June and November, or just about at the time the river level starts to rise due to the rainy season in the headwaters, these large schools start to congregate and move towards the Western Amazon. The fish travel about 5 to 6 months to spawn exclusively in the headwaters of the white water tributaries of the SAS. These headwater tributaries are distributed over at least five different countries (Brazil, Peru, Colombia, Ecuador, and Bolivia), and the total distance covered by these schools from the mouth of the Amazon may reach up to 5500 km. After spawning in the Western Amazon, the larvae are passively carried by the water currents back to the main river channel of the SAS. By calculating the water speed, it is estimated that B. rousseauxii born in the headwaters may take between 13 and 20 days to reach the estuary again. In the protected and nutrient-rich estuarine environment, the young grow for approximately three years, during which time they move up to the lower portion of the main channel of the Amazon River. There, the fish may stay for another year surviving on larger prey. After this growing period, schools form again and start migrating west towards the headwaters, to complete the cycle. The conception of such a migratory model represents a major advance towards a better knowledge of the natural history of the migrating catfish in the Amazon, but several points still remain to be elucidated. For instance, for the practical aspects of management and conservation policies, it is mandatory to know if the species considered is really composed of a single, genetically homogeneous stock, or if there is some kind of genetic segregation associated with space (between affluents) and time (between cohorts), or if the entire species performs the migratory journey at the same time. Depending on the answer obtained, different conservational units can be defined and appropriate policies adopted. It is also important to know if there are resident populations along the area considered. Another relevant aspect related to this life cycle is the importance of the different tributaries for the reproduction of B. rousseauxii. Do the individuals return to the same tributary where they were born, forming “monophyletic” population groups in each sub-basin, or is the tributary chosen for spawning defined by chance or other fluctuating/momentary, environmental parameters? It is also not known how many times a fish can perform the reproductive migration during its lifetime. Given the species’ complex life cycle plus the nature and size of the area involved, traditional methods of fishery biology (meristic and morphological characters) to define stocks have not proven to be enough. The general migratory scenario proposed (Barthem and Goulding, 1997) has never been tested before from a genetic perspective, and it has been established that such questions can receive a substantial help from molecular markers (Avise, 2004), as we associated genetic diversity with geographical location. Here, we report the first assessment of the intraspecific genetic variability with its correlation to geography for an Amazonian migratory fish species based on mitochondrial DNA sequences. The molecular marker used was the complete sequence of the mitochondrial control region (also know as D-loop). Our main objective was to obtain preliminary and reliable information about the phylogeography of the species and to establish if the genetic variability found was related to geographical distribution. Such information can help us to compile meaningful scientific information about the life cycle of this species and serve as a basis to subsidize management and conservation policies in the near future. MATERIAL AND METHODS Sampling Specimens of B. rousseauxii were collected at three points along the SAS: Belém, Manaus and Tabatinga (Figure 1). At each location, 15 individuals were sampled from the artisanal fishing fleet during 1998 and 1999. Special attention to sample from the artisanal fisheries was because this kind of activity uses small boats with little autonomy, and therefore, all their fishing activity is within a radius of no more than 20 km from the town selected. In this way, we were assured that our samples represented the genetic diversity of individuals occurring around each location, which is crucial if we wanted to test the possibility of differentiating possible resident populations. Special care was also taken in order to sample the largest variety of sizes possible and on different days, as a measure to reduce the chance of sampling the same cohort. Besides the individuals of B. rousseauxii, one specimen of B. vaillantii collected in Belém was also included in the phylogenetic analysis as the sister group. Samples of muscle of each individual were excised with sterilized blades and pliers and conditioned in tubes with 80% ethanol until DNA extraction in the laboratory. DNA extraction, PCR and sequencing An SDS-phenol/chloroform/isoamyl alcohol protocol was used to obtain total DNA (Alves-Gomes et al., 1995). The quality of the extracted DNA was determined on 0.8% agarose gels stained with ethidium bromide and photographed with a digital photo-documentation apparatus (Eagle Eye - Stratagene). A fragment encompassing the entire mitochondrial control region of each individual was amplified in a PCR reaction with a total volume of 30 µL with 10-100 ng of total DNA, 1.5 mM MgCl2, 1X Taq buffer, 200 µM dNTPs, 0.5 µM of each primer, and 0.5 unit Taq DNA Polymerase. The primers used have the following sequences: F-TTF: 5’ GCC TAA GAG CAT CGG TCT TGT AA 3’ and F-12R: 5’ GTC AGG ACC ATG CCT TTG TG 3’ (Sivasundar et al., 2001). The amplification was carried out in 30 cycles with the following temperature profile: the first five cycles were executed with 1 min at 94°C, 1 min at 53°C and 1.5 min at 72°C. In the remaining 25 cycles the annealing temperature was dropped to 50°C. The efficiency of the amplification was determined on 0.8% agarose gels, with a molecular weight marker (l DNA digested with HaeIII). All the amplified products were purified with the Wizard kit (Promega) following the protocol of the manufacturer. The purified product (mtDNA control region) was sequenced with the ABI PRISM BigDye Terminator Cycle Sequencing in an ABI 377 automated DNA sequencer (Perkin Elmer), following the protocol accompanying the cycle sequencing kit. Sequences were checked, edited and aligned using the program SEQED 1.0.3 (ABI, 1992). Phylogenetic and statistical analyses The phylogenetic estimations were performed by three methodological principles: maximum parsimony (MP), maximum likelihood (ML) and distance, with the program PAUP* version 4.0 (Swofford, 1999). For the parsimony analyses, two weight matrices for transitions (TS) and transversions (TV) were used: TS1TV1, where the same cost of one step was given to the two types of mutations, and TS1TV2, where each TV costs twice the number of steps of each TS. No analyses were performed considering gaps as a fifth character state because no gaps were present among the B. rousseauxii sequences (all gaps were autapomorphies for B. vaillantii). All parsimony analyses were carried out including an individual of B. vaillantii as the outgroup. The remaining options for parsimony in PAUP* were: characters were unordered, multistate characters were considered uncertain, gaps were treated as missing, and uninformative sites were excluded. Most parsimonious trees were generated by heuristic search and the taxa were added by random stepwise addition. One hundred replications were performed with TBR as a method for clade permutation. For each tree we obtained the length (L), measured by the number of steps, the consistency index (C.I.) and the retention index (R.I.). The consensus trees for both weight matrices were obtained by strict consensus and by the 50% majority rule. The degree of confidence for each branch of the tree was estimated by bootstrap (Felsenstein, 1985) with 1000 replications. For ML searches, the evolutionary model was defined with the program MODELTEST 3.0 (Posada and Crandall, 1998). The model adopted was the Hasegawa-Kishino-Yano (HKY 85) (Hasegawa et al., 1985) considering the gamma distribution (G) for the number of mutations per site, and the proportion of invariable sites (I). The empirical frequency of nucleotide bases and the TS/TV ratio were also defined by the program. For the distance method, we created an uncorrected distance matrix (p distance) from which we extracted the number of TSs and TVs for all pairwise comparisons. In order to check any possible saturation of TS and TV, we plotted the p distance versus both types of mutations for each pairwise distance. Subsequently, the distances were corrected for multiple hits with the same model used in ML (HKY + G + I). From this corrected matrix, we also estimated a tree by the neighbor joining (NJ) method. Population genetics analyses The number of haplotypes within each of the populations (location) sampled was determined with the program COLAPSE 1.2 (http://darwin.uvigo.es/software/collapse.html). Several other parameters which estimate the DNA polymorphism were determined with the program DNASP 4.0 (Rozas and Rozas, 1999). The following parameters were estimated: haplotypic diversity - HD, nucleotide diversity - Pi (Nei, 1987), average pairwise distance - K and respective variances [observed V(k)o, and estimated V(k)e] (Tajima, 1983), total number of mutations - ETA; number of polymorphic sites - S; the average number of substitutions per site - Dxy, net number of substitutions per site - Da (Nei, 1987), and genetic flux, or number of migrants between populations per year - Nm (Nei, 1982). The Jukes-Cantor model was also adopted (Jukes and Cantor, 1969) in order to determine if the molecular variability found among and between the populations of B. rousseauxii were significant. An analysis of molecular variance (AMOVA) (Excoffier et al., 1992) was performed with the program ARLEQUIN 2.0 and the level of significance for the indices and for the total variance was tested by 1000 non-parametric permutations of the haplotypes between the populations (Schneider et al., 2000). Nested clade analysis The nested clade analysis (NCA) (Templeton et al., 1987, 1988, 1992, 1995) is a method developed to estimate intra-specific genealogies and to test if the topology obtained for the haplotypes is associated with some type of geographic structure. This analysis was performed with the 45 B. rousseauxii sequences. The intra-specific cladogram was produced with the program TCS 1.06 (Clement et al., 2000) and the final nested clade topology was obtained manually, according to the procedures described by Crandall and Templeton (1993, 1996) and Crandall (1996). Subsequently, we used the program GEODIS 2.0 (Posada et al., 2000) to calculate the statistics related to the clade distances and to test if the several levels of clades and sub-clades obtained were also associated with a geographic structure. The significance levels of the analyses were obtained by 10,000 random permutations considering the number of individuals sampled at each location and the geographic distance between each location where the haplotypes were collected. The distances between locations were estimated on a map, following the course of the river: Belém-Manaus » 1000 km, Manaus-Tabatinga » 1200 km and Belém-Tabatinga » 2200 km. The analyses also include an exact contingency test, where the null hypothesis of no association between the clades and the geographic locality was tested. Two types of distances for each sub-clade were calculated: the clade’s internal distance (Dc) and the distance between clades (Dn). The distance between clades is the average of these distances. The program also calculates two other distances between interior (I) and tip (T) clades: I-Tc and I-Tn (Templeton et al., 1995; Templeton, 1998). Once all the distances were calculated, the results were interpreted according to a biological key conceived by Templeton (1998). RESULTS Nucleotide sequences and base composition The complete DNA sequence for each individual totaled 1037 bp and comprised 12 bp of threonine tRNA, the complete 70 bp of proline tRNA, the complete sequence of 911 bp of the D-loop, and another 44 bp corresponding to the partial sequence of the phenylalanine tRNA. When the specimen of B. vaillantii (genbank accession number DQ779047) was incorporated into the matrix as a sister group, the alignment of the 46 sequences generated a data matrix with 1069 bp, with the necessary introduction of 32 indels (insertion/deletion events). In the matrix without the outgroup, 983 bp were constant, 54 were variable and, among these, 30 were phylogenetically informative, whereas with the outgroup included 905 sites were constant, 129 variable and 35 informative. The average base composition for the 45 mitochondrial DNA control region sequences of B. rousseauxii was 32.49 ± 0.17% for thymine, 32.18 ± 0.12% for adenine, 21.25 ± 0.17% for cytosine, and 14.07 ± 0.08% for guanine. In addition, in the 54 polymorphic sites of the 1037-bp matrix, 57 substitutions were observed, which were 45 TS and 12 TV, giving a transition/transversion (TS/TV) ratio of 3.9. No saturation was detected for both TS and TV when the absolute number of the two types of mutations was plotted against the uncorrected “p” distance (Figure 2).
Phylogenetic analysis For MP searches, the analyses produced four trees equally parsimonious for each of the weight matrix used (TS1TV1 and TS1TV2). For TS1TV1, the L was 208 steps, the C.I. = 0.822 and R.I. = 0.809 and for TS1TV2, L = 271; C.I. = 0.838 and R.I. = 0.802. The strict consensus trees of both types of weighting schemes were identical. For searches under the MP criterion, the HKY + G + I was used as an evolutionary model. These parameters and values were defined as: proportion of invariable sites = 0.633; gamma parameter = 0.6723; TS/TV ratio = 4.55, and the proportion of bases were A = 0.3194, C = 0.2115, G = 0.1428, T = 0.3263. With these parameters, we obtained a topology with -Ln = 2508.26406. We also used the model HKY + G + I to calculate the average distance among and between the individuals collected in the three sampling locations (Table 1) and to generate a topology based upon the NJ algorithm. We found distances varying between 0.0 and 3.5% among B. rousseauxii, whereas the uncorrected “p” genetic distance between B. rousseauxii and the outgroup varied between 12.5 and 13.7%. A 50% majority rule consensus tree was computed among the 10 trees found under all conditions used (4 resultant trees for MP TS1TV1, 4 trees for MP TS1TV2, 1 tree for ML and 1 tree for NJ) (Figure 3).
Haplotype frequency and distribution A total of 34 haplotypes were identified when each location was computed separately, consisting of 15 in Belém, 10 in Manaus, and 9 in Tabatinga. As we proceeded to define the singleton distribution (haplotypes represented by a unique sequence or individual in the population) for these 34 haplotypes, Belém had 15 (no repeated haplotype), Manaus had 8 (haplotypes D17 and D18 repeated four and three times, respectively) and Tabatinga 6 (haplotypes D17 and D28 twice, and D18 five times). Because some haplotypes were present in Belém and Tabatinga (D14) and in Manaus and Tabatinga (D17 and D18), 31 haplotypes and 27 singletons were identified when the three locations (45 individuals) were considered altogether (Table 2).
Population diversity analysis The results obtained for estimation of the intra- and inter-population DNA variability and the other parameters related to DNA polymorphism are shown in Tables 3 and 4. Figure 4 shows an illustrative summary of the variability found. For the most relevant parameters calculated (H, S, ETA, and HD), the variability found among the individuals collected in Belém is larger than in Manaus. In turn, the genetic variability of the individuals collected in Manaus is higher than the variability found in Tabatinga.
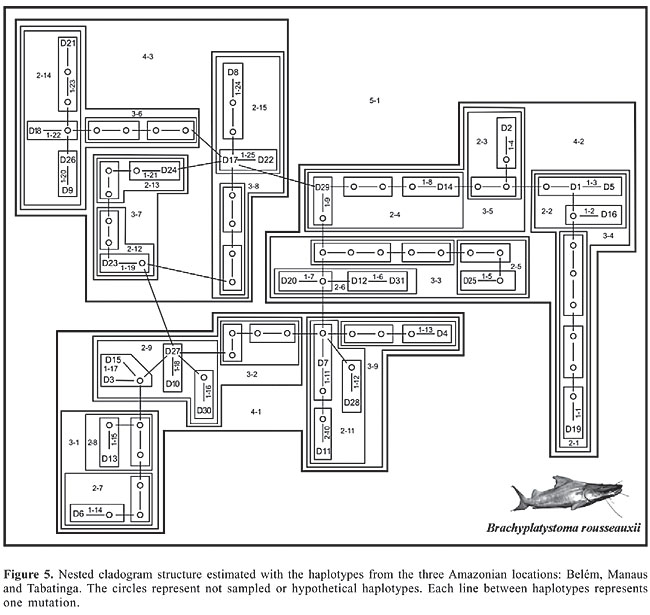
More than 93% of the total variance was observed within the locations, whereas 6.61% was distributed among the locations (Fst = 0.0661, P < 0.05). The genetic variability was significantly different between the locations at Belém and Manaus (Fst = 0.10; P < 0.01) and between Belém and Tabatinga (Fst = 0.10; P < 0.05). Thus, the genetic variability found in Belém was significantly larger than the diversity found in Manaus and Tabatinga, corroborating the data in Tables 4 and 5. No significant difference was found between the genetic diversity of Manaus and that of Tabatinga. Nested clade analysis Figure 5 depicts the cladogram of the haplotypes (Table 2), for a 95% degree of confidence. In Table 5 we show the steps followed for the biological inference, using the key of Templeton (1998). The results obtained establish that for step-clades from 1 to 4, there were no significant distances (Dc or Dn). A significant value was only obtained for step-clade of level 5, which represents the entire cladogram. The analyses performed with the objective to determine if there was any genetic structure associated with geographic distribution failed to reveal such association. Therefore, we could not distinguish isolated (sub) populations of B. rousseauxii in the SAS main channel.
DISCUSSION Phylogenetic analyses The absence of genetic segregation of B. rousseauxii associated with geographic location is well characterized at the 50% majority rule consensus tree for all 10 resultant topologies (Figure 3) obtained for the fish collected in Eastern, Central and Western Amazon. This result supports the hypothesis of a single stock of B. rousseauxii migrating between the estuary and the headwaters to spawn (Barthem and Goulding, 1997). In principle, we have a genetically mixed stock that uses the main river channel along the entire extension of the SAS main channel. The genetic distance among the 45 individuals of B. rousseauxii, corrected by the HKY85 model, varied between 0.0 and 3.5% (average = 0.8 ± 0.3). When the pairwise distance was computed for each location separately, we obtained values varying between 0.0 and 2.3% (average = 1.2 ± 0.5) for Belém, 0.0 and 3.5% (average = 1.0 ± 0.7) for Manaus and 0.0 and 1.5% (average = 0.8 ± 0.4) for Tabatinga. When we computed distances for pairs of locations, we found values between 0.2 and 3.5% (average = 1.2 ± 0.7) between Belém and Manaus, 0.0 and 2.3% (average = 1.1 ± 0.4) between Belém and Tabatinga, and 0.0 and 2.9% (average = 0.9 ± 0.6) between Manaus and Tabatinga. The largest absolute distance in the matrix was 3.5%, between two individuals from Manaus (individuals 294MA and 188MA), but when the average pairwise distance was computed for each locality, Belém had the largest variability and Tabatinga the smallest (Table 1). In all the phylogenetic trees, the specimen 294MA, collected in Manaus, was depicted as the most basal taxon for the group of individuals analyzed. The genetic distances associated with this specimen were always the largest found in the pairwise calculations, going from 1.1 to 3.5%, pushing the average distance found in Manaus to the levels found in Belém. Additional sampling may reveal if this haplotype is also found in other locations and if it might, in fact, really be a representative of an “ancestral” population of B. rousseauxii in the Amazon. The genetic distances found in the present study are within the range found for other Amazonian species, for the same DNA marker, such as Prochilodus lineatus (0.3-3.5%) (Sivasundar et al., 2001) and Mylesinus paraschomburgkii (0.0-6.9%) (Porto, 1999). Population analyses: haplotype distribution and DNA polymorphism The decrease in the genetic variability of B. rousseauxii from Belém to Manaus to Tabatinga (Tables 3 and 4 and Figure 4) can be unambiguously inferred from the several parameters calculated such as, HD, S, ETA, Pi, K, and number of non-shared polymorphic sites between populations. On the other hand, the absence of fixed mutations between the individuals of the three locations may be considered as a strong indication that the individuals are not genetically isolated in the SAS main channel. The haplotype distribution and occurrence suggest a higher similarity between the populations of Manaus and Tabatinga (Table 2). According to haplotype diversity, Belém contains the higher diversity, supporting the results also related to nucleotide diversity (Tables 3, 4 and Figure 4). In fact, by all parameters analyzed, the variability tends to decrease towards the west, from Belém to Tabatinga. Among the possible explanations that can account for that is that there are resident and genetically more divergent populations in the middle and lower Amazon that do not reach the headwaters. However, this is not likely considering the strong evidence for a migratory cycle in B. rousseauxii based on experimental fisheries, gonadal maturation and information from fishermen. A second possible explanation is the very high capture rate in Manaus and Tabatinga, which causes a decrease in genetic diversity in these places. In other words, parts of the total gene pool are being captured in the several white water affluents along the way. Only a fraction of the individuals really reaches the furthest tributaries. The most likely third plausible phenomenon is that part of the genetic diversity of the species does not reach the western part of the Amazon because the schools formed near the estuary return to the river where they were born, and not to a randomly chosen tributary. According to Kimura and Maruyama (1971), two populations can be differentiated if the gene flow estimator Nm (where N is the effective population size and m is the rate of mutation/site/generation) assumes values below 1, whereas a single and panmictic population unit would be considered for values above 4. In this study, the Nm estimated between the populations was always larger than 4 (Table 4). The values of Nm point to migration and/or mixing between populations, and consequently gene flow between the three locations, which defines a single population of B. rousseauxii in the SAS main channel. The relatively low values of intra- and inter-population nucleotide diversity (Pi), the average number of substitutions/site (K) and the net rate of substitutions (Da), reinforce such a concept (Tables 3 and 4). However, we still need to confirm if the different tributaries hold genetically segregated populations. Nested clade analysis Intra-specific phylogenies constitute a different substrate for evolutionary principles than phylogenetic relationships between species, and therefore their study requires a distinct approach (Posada and Crandall, 2001). In this regard, the NCA can help us to understand the evolutionary relationship among the individuals/haplotypes, also considering the geographic information related to the clade under study. In the nested cladogram we constructed (Figure 5), we observed the same basic result of no genetic differentiation associated with collection site or geographical distribution, as we observed in the phylogenetic analysis. There was no significant value for any level up to the four-step clades. As we examine the values for Dc, Dn, I-Tc, and I-Tn found under the biological key (Templeton, 1998), we cannot reject H0, i.e., there is no association between geographic distribution and the genetic diversity of the haplotypes. For the results obtained, three possibilities are suggested (Templeton, 1998): either an interbreeding population in panmixia, a wide distribution of a non-interbreeding population or reduced sample size. In this study, we believe the first alternative seems to be more likely the case. The only nested clade that showed significant values was the five-step clade (5-1) which encompasses the entire cladogram (Figure 5). By inference from the key, the explanation invokes restricted gene flow and/or long distance dispersion in the populations/individuals considered, i.e., between individuals of Belém and Tabatinga. An alternative hypothesis for the life cycle of Brachyplatystoma rousseauxii According to all the results obtained in the different analyses (phylogenetics, DNA polymorphism, AMOVA, and NCA), with the specimens collected from the three locations (Belém, Manaus and Tabatinga), we proposed the following scenario: we cannot reject the hypothesis of a single, mixed population along the SAS main axis (Barthem and Goulding, 1997). In Belém, however, we have a significantly higher genetic variability of the species. In our model, this is because the estuary congregates individuals originating from all the white water affluents of the SAS. Furthermore, if the choice of affluent was driven by chance only, we should not detect any decrease in DNA polymorphism in the western part of the Amazon, since the complete gene pool would represent all locations. Tabatinga, on the other hand, possesses the lowest genetic variability among the locations sampled. This would be possible because the whole gene pool of the species, initially concentrated in Belém, is diminished as the migratory schools move from the estuary to the headwaters of the tributaries, and a large majority of the migrating fish are able to return to the same tributary where they were born, not choosing their affluent to spawn by chance or momentary circumstances during the reproductive migration, i.e., the species is homing, as do the salmon in North America. There is only one large white water river between Belém and Manaus, the Madeira, whereas between Manaus and Tabatinga there are two large rivers on the right (Purus and Juruá) and two on the left (Japurá and Içá) margins. Therefore, if the hypothesis outlined before is correct, we should expect a larger drop in genetic variability between Manaus and Tabatinga than between Belém in Manaus. This can be observed for the S and ETA parameters (Figure 4). The white water affluents of the SAS appear to serve as a “sink” of the genetic diversity for the migrating of B. rousseauxii in the Amazon. This hypothesis is relatively easy to test, as the samples obtained within the different tributaries should show a very low genetic divergence or “monophyletic” assemblages. These populations mix in the SAS during a considerable portion of their life cycle, but segregate for reproduction. According to Barthem and Goulding (1997), migration of this species is associated with the white water tributaries of the Amazon basin. There is no information, if or to what extent B. rousseauxii also uses other non-white water rivers of the SAS for reproduction, such as the rivers Tocantins, Tapajós, Xingu, Trombetas, Uatuma, Jari, and Negro. We know from local fishermen that B. rousseauxii may reach up to the middle of the Negro River, but this is not a common event. We also have information from fishermen that B. rousseauxii may be found in the upper parts of the Tapajós and Xingu Rivers, but we do not know how far or if there is any reproductive activity of this fish at these locations. It is well known that the nutrient-poor and acidic black waters of the Negro River do not provide enough food for the large and voracious schools of migratory pimelodids. It is not surprising, therefore, that all the commercial fishery activity in the Amazon is associated with the nutrient-rich and highly productive white water rivers. The main white water rivers of the Amazon are the Madeira, Purus and Juruá on the right margin and the Napo, Putumayo/Içá and Caquetá/Japurá on the left margin. We obtained one sample of a young B. rousseauxii from one of the main affluents of the Negro River (the Branco River) which may imply an important role of the Negro River Basin in the life cycle of B. rousseauxii. There are B. rousseauxii also in the Orinoco River Basin where migrations similar to that in the Amazon also occur (Ramirez-Gil H, personal communication), but we know even less about the Orinoco populations than the Amazonian. There is an intermittent contact between the Orinocan and Amazon basins through the headwaters of both basins, but such contact is unlikely to allow the transpositions of large fish or schools, such as those of Brachyplatystoma, between basins. The degree of genetic differentiation between the Amazonian and Orinoco populations still remains to be studied. Isozyme and RAPD data were used to assess the variability between populations of Pseudoplatystoma fasciatum and P. tigrinum, two apparently non-migratory pimelodid species with a larger distribution in the Neotropics than Brachyplatystoma from the Orinoco and the Amazonian Basin. Despite the lack of variation at the enzyme level, the author could tell the Orinocan and Amazonian population apart based on RAPD for both species (Ramirez Gil, 2001). Probably the same is true for B. rousseauxii, but no information about the genetic variability or gene flow between the B. rousseauxii of the two river systems is available. Considering this scenario, it is important to call attention to the potential biological importance that the different tributaries may represent for the life cycle of B. rousseauxii. Policies for its conservation and management and that of other migratory species such as B. vaillantii and possibly B. filamentosum, should carefully consider the hypothesis proposed here. If different rivers have different populations, then any action involving a single river may affect a considerable portion of the genetic variability of the species studied. It is also important to consider the fact that B. rousseauxii uses different areas for growth and for reproduction. This whole situation gains additional importance if we consider that the species is present and captured at least in five different countries. The social and economic benefit resulting from the commercial exploitation of this species depends, intimately, on correct management policies that can guarantee the sustainable use of this resource. ACKNOWLEDGMENTS The authors thank Dr. Iracilda Sampaio from Universidade Federal do Pará (UFPA) for help on getting sequences, Juan Carlos Alonso, SINCHI/Colômbia, for help on sample collection, Guillermo Orti from University of Nebraska for the primers, Izeni Farias from LEGAL/ICB/UFAM, and Tomas Hrbek from University of Puerto Rico for help in some analyses. We also thank Fundação de Amparo à Pesquisa do Estado do Amazonas (FAPEAM), CNPq and MCT-INPA (grant PPI 1-3550) for financial support. REFERENCES ABI (1992). SEQED: Sequence Editor, version 1.0.3. ABI, Foster City. Alonso JC (2002). Padrão espaço temporal da estrutura populacional e estado atual da exploração pesqueira da dourada Brachyplatystoma flavicans, Castelnau, 1855 (Siluriformes: Pimelodidae), no sistema Estuário-Amazonas-Solimões. Doctoral thesis, INPA/UFAM, Manaus. Alves-Gomes JA, Orti G, Haygood M, Heiligenberg W, et al. (1995). Phylogenetic analysis of the South American electric fishes (order Gymnotiformes) and the evolution of their electrogenic system: a synthesis based on morphology, electrophysiology, and mitochondrial sequence data. Mol. Biol. Evol. 12: 298-318. Avise JC (2004). Molecular markers, natural history and evolution. Sinauer Associates Inc., Sunderland. Barthem RB and Petrere M (1995). Fisheries and population dynamics of the freshwater catfish Brachyplatystoma vaillantii in the Amazon estuary. In: Proceedings of the World Fisheries Congress, Theme 1. Condition of the World’s Aquatic Habitats (Armantrout NB and Wolotira R, eds.). Oxford and IBH Publishing Co. Pvt. Ltd., Calcutta, 329-340. Barthem RB and Goulding M (1997). Os bagres balizadores: ecologia, migração e conservação de peixes amazônicos. Sociedade Civil Mamirauá; CNPq, Brasília. Clement M, Posada D and Crandall KA (2000). TCS: a computer program to estimate gene genealogies. Mol. Ecol. 9: 1657-1659. Crandall KA (1996). Multiple interspecies transmissions of human and simian T-cell leukemia/lymphoma virus type I sequences. Mol. Biol. Evol. 13: 115-131. Crandall KA and Templeton AR (1993). Empirical tests of some predictions from coalescent theory with applications to intraspecific phylogeny reconstruction. Genetics 134: 959-969. Crandall KA and Templeton AR (1996). Applications of intraspecific phylogenetics. In: New uses for new phylogenies (Harvey PH, Brown AJ, Smith JM and Nee S, eds.). Oxford University Press, New York. Excoffier L, Smouse PE and Quattro JM (1992). Analysis of molecular variance inferred from metric distances among DNA haplotypes: application to human mitochondrial DNA restriction data. Genetics 131: 479-491. Felsenstein JF (1985). Confidence limits on phylogenies: an approach using the bootstrap. Evolution 39: 783-791. Hasegawa M, Kishino H and Yano T (1985). Dating of the human-ape splitting by a molecular clock of mitochondrial DNA. J. Mol. Evol. 22: 160-174. JICA/MPEG/IBAMA (1998). The fishery resources study of the Amazon and Tocantins river mouth areas in the Federative Republic of Brazil. Jukes T and Cantor C (1969). Evolution of protein molecules. In: Mammalian protein metabolism (Munro HN, ed.). Academic Press, New York, 21-132. Kimura M and Maruyama T (1971). Pattern of neutral polymorphism in a geographically structured population. Genet. Res. 18: 125-131. Nei M (1982). Evolution of the human races at gene level. In: Human genetics, part A: The unfolding genome (Bonne-Tamir B, Cohen T and Goodman RM, eds.). Alan R. Liss, New York, 167-181. Nei M (1987). Molecular Evolutionary Genetics. Columbia University Press, New York. Petrere M, Barthem RB, Cordoba EA and Gomez BC (2004). Review of the large catfish fisheries in the upper Amazon and the stock depletion of piraíba (Brachyplatystoma filamentosum Lichtenstein). Rev. Fish. Biol. Fish. 14: 403-414. Porto JI (1999). Análises cariotípicas e seqüenciamento de mtDNA de populações de Mylesinus paraschomburgkii (Characiformes, Serrasalmidae) da Bacia Amazônica. Doctoral thesis, INPA/UFAM, Manaus. Posada D and Crandall KA (1998). MODELTEST: testing the model of DNA substitution. Bioinformatics 14: 817-818. Posada D and Crandall KA (2001). Intraspecific gene genealogies: trees grafting into networks. Trends Ecol. Evol. 16: 37-45. Posada D, Crandall KA and Templeton AR (2000). GeoDis: a program for the cladistic nested analysis of the geographical distribution of genetic haplotypes. Mol. Ecol. 9: 487-488. Ramirez Gil H (2001). Diferenciação genética de populações de surubim (Pseudoplatystoma fasciatum) e de caparari (Pseudoplatystoma tigrinum) nas bacias do Magdalena, Orinoco e Amazonas. Doctoral thesis, INPA/FUA, Manaus. Rozas J and Rozas R (1999). DnaSP, version 3: an integrated program for molecular population genetics and molecular evolution analysis. Bioinformatics 15: 174-175. Schneider S, Roessli D and Excoffier L (2000). Arlequin, version 2.000: a software for population genetic data analysis. Genetics and Biometry Laboratory, University of Geneva, Geneva. Sivasundar A, Bermingham E and Orti G (2001). Population structure and biogeography of migratory freshwater fishes (Prochilodus: Characiformes) in major South American rivers. Mol. Ecol. 10: 407-417. Swofford DL (1999). PAUP*. Phylogenetic Analysis Using Parsimony (*and Other Methods).Version 4. Sinauer Associates Inc., Sunderland. Tajima F (1983). Evolutionary relationship of DNA in finite populations. Genetics 105: 437-460. Templeton AR (1998). Nested clade analysis of phylogeographic data: testing hypotheses about gene flow and population history. Mol. Ecol. 7: 381-397. Templeton AR, Boerwinkle E and Sing CF (1987). A cladistic analysis of phenotypic associations with haplotypes inferred from restriction endonuclease mapping. I. Basic theory and an analysis of alcohol dehydrogenase activity in Drosophila. Genetics 117: 343-351. Templeton AR, Sing CF, Kessling A and Humphries S (1988). A cladistic analysis of phenotype associations with haplotypes inferred from restriction endonuclease mapping. II. The analysis of natural populations. Genetics 120: 1145-1154. Templeton AR, Crandall KA and Sing CF (1992). A cladistic analysis of phenotypic associations with haplotypes inferred from restriction endonuclease mapping and DNA sequence data. III. Cladogram estimation. Genetics 132: 619-633. Templeton AR, Routman E and Phillips CA (1995). Separating population structure from population history: a cladistic analysis of the geographical distribution of mitochondrial DNA haplotypes in the tiger salamander, Ambystoma tigrinum. Genetics 140: 767-782.
1In its entire length, the Amazonas River covers a total of about 5900 km, passing by four countries and receiving seven different names. Here we refer as Solimões-Amazonas System as the stretch of the main channel and its associated white water tributaries. |
|