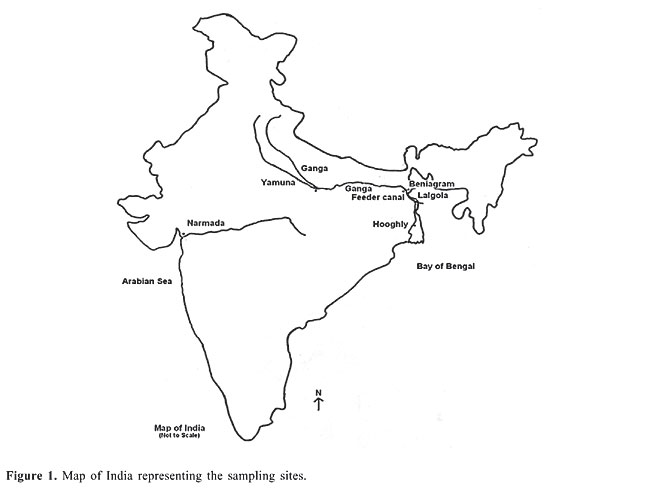
ABSTRACT. RAPD was used to delineate the hilsa populations sampled from the Ganga, Yamuna, Hooghly, and Narmada Rivers at six different locations. Six degenerate primers were used to generate the fragment patterns from the samples collected. All primers were highly polymorphic and generated high numbers of amplification products. Nei’s genetic distances were calculated between locations. The overall average genetic distance among all the six locations was 0.295. The Fst value within the Ganga was 0.469 and within the Hooghly it was 0.546. The overall Fst value for the six populations analyzed was 0.590. The UPGMA dendrogram clustered the hilsa into two distinct clusters: Ganga and Yamuna populations and the Hooghly and Narmada populations. Key words: Tenualosa ilisha, Ganga, Yamuna, Hooghly, Narmada, RAPD, PCR INTRODUCTION Tenualosa ilisha is an anadromous fish occurring in the Indo-West Pacific region from the Persian Gulf, along the coast of Pakistan, India, Bangladesh, and Burma to South Vietnam. It occurs in the foreshore areas, estuaries, brackish water lakes, and freshwater rivers. It ascends the rivers for breeding during the monsoon season and returns to the sea after completion of spawning to marine habitats. Hilsa is an important tropical fish belonging to the family Clupeidae and sustains a highly commercial fishery in the Ganga and the Hooghly estuaries in India. All hilsa stocks appear to breed in the upper reaches where eggs, larvae and juveniles are found during the spawning seasons. During the southwest monsoon, which forms the main breeding season, all the early stages can be found in the spawning grounds. The normal habitat of hilsa is the lower regions of the estuaries and the foreshore areas. During the breeding season they ascend the rivers and after spawning return to the original habitat where they remain until the next breeding season (Pillay and Rosa, 1963). The upstream migration during the main breeding season appears to depend largely on the commencement of the southwest monsoon and consequent flooding of the rivers. The variations in the intensity of monsoon during the breeding season appear to cause considerable fluctuations in the abundance of the fish and catches in different places. In India, hilsa distribution has been recorded from the Narmada and Tapti Rivers and from the Vembanad backwaters of western India. In the eastern region hilsa is distributed in the Cauvery, Krishna, Godavari, Mahanadi, Hooghly, and Ganga Rivers (Chonder, 1999). In 1873, Day described two classes of hilsa from the rivers, a) one-year-old hilsa appearing not to breed and b) those breeding at the start and during the monsoon. Jenkins (1938) raised the question whether two or more hilsa races or varieties exist with different spawning grounds. Mojumdar (1939) recognized three ecotypes of hilsa: from saline water of the sea, muddy freshwater and clear freshwater. Pillay et al. (1963) differentiated three stocks of hilsa using biometrical studies. Based on morphological characteristics, Ghosh et al. (1968) and Quddus et al. (1984) differentiated hilsa into slender and broad morphotypes. Pillay et al. (1963) concluded that the hilsa populations of the Hooghly, Padma and Ganga show little or no movement between the rivers, with little intermingling of populations. Dahle et al. (1998) used random amplified polymorphic DNA (RAPD) and discriminated between three different populations of hilsa. Similarly, Shifat et al. (2003) used RAPD to differentiate the Padma and Meghna River hilsa populations into two genetically different stocks or races. Thus, to gain insight into the structure of hilsa populations, the RAPD technique was used to delineate populations from their spawning habitats in Indian rivers. MATERIAL AND METHODS The muscle and liver samples of Tenualosa ilisha (N = 72) were collected from six different locations on the Yamuna River at Allahabad, Ganga River at Beniagram and Lalgola River (which are downstream from Farakka barrage) at Feeder Canal, Farakka (which joins the Bhagirathi River), at Nawabganj on the Hooghly River and at Bhadbhud on the Narmada River (Figure 1). The tissue samples were preserved in 90% ethanol and genomic DNA was extracted following the Sambrook and Russel (2001) protocol with some modifications. Briefly, 0.1-0.5 mg of muscle tissue was homogenized in lysis buffer (10 mM Tris-Cl, pH 8.0, 1 mM EDTA, pH 8.0, 0.1% w/v SDS) and incubated with 5 µg of proteinase K at 55°C overnight. Afterward, genomic DNA was extracted using the conventional phenol-chloroform method with a wash of 70% ethanol. The DNA was air-dried, dissolved in sterile distilled water and stored at 4°C until polymerase chain reaction (PCR) amplification was performed. The DNA samples were tested for quality using a spectrophotometer prior to using them in the RAPD-PCR technique. Six degenerate oligodecamer primers (Operon Technologies, USA) were used to perform RAPD (Dahle et al., 1998). PCR was carried out in a 25-µL reaction mixture containing 100 ng DNA, 100 pM decamer primer, 10 mM dNTP mixture (Dynazyme), 10X PCR buffer (Dynazyme), 1.5 mM MgCl2, and 0.05 U Taq polymerases (Dynazyme). Amplifications were performed in an Applied Biosystems GeneAmp PCR system 2400 instrument programmed for one cycle at 94°C for 4 min, 40 cycles at 94°C for 1 min, annealing at 34°C for 1 min, and extension at 72°C for 2 min. A final extension was performed at 72°C for 10 min. Ten microliters of the amplified products with 3 µL of loading dye (bromophenol blue and xylene cyanol) were resolved on 1.6% agarose (Sigma) in 0.5X TBE buffer (0.89 M Tris borate, pH 8.3, 0.02 M EDTA, for 10X) at 100 V for 3 h and stained with 0.5 µg/mL ethidium bromide (Sigma). The gels were documented in the BioRad gel documentation system and the molecular weight of the fragments was determined using Quantity-one software (BioRad, USA).
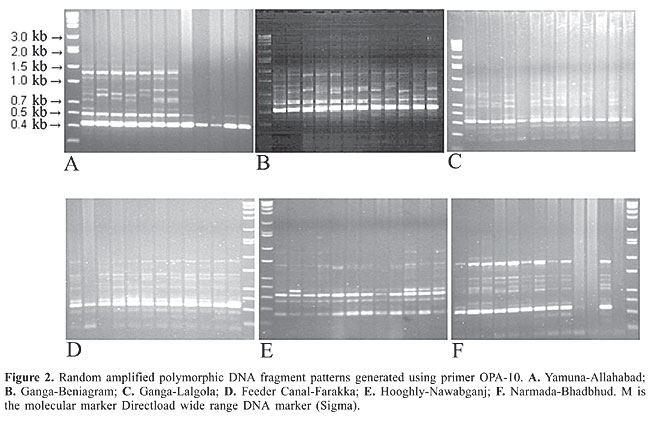
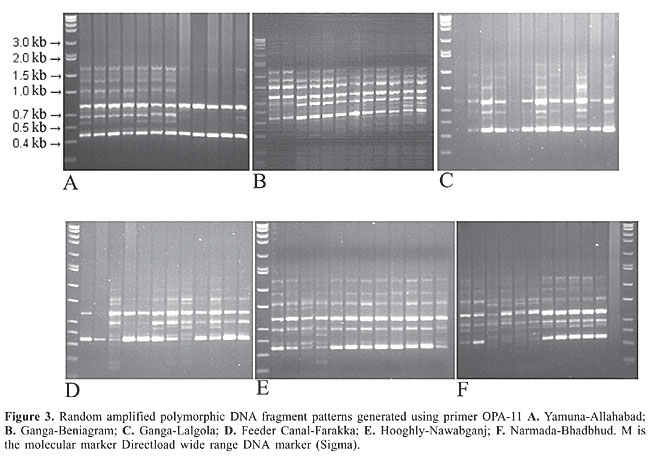
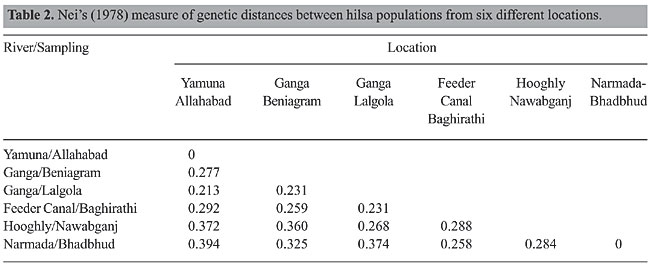
RESULTS The RAPD fragments were scored for the presence and absence of fragments on the gel photographs, and RAPD fragments were compared among the six hilsa populations. RAPD banding patterns were recorded on spreadsheets, which were used to determine Nei’s (1978) gene diversity, gene flow, number of polymorphic loci and genetic distance and to construct an unweighted pair group method of arithmetic mean (UPGMA) dendrogram among populations using POPGENE 1.31 (Yeh et al., 1999). The test of homogeneity was also performed using the same program. The population differentiation (Fst) was estimated on the basis of square root transformation of the frequencies of the recessive genotype, and the 95% confidence interval was calculated from bootstrapping over loci with 10,000 replications using the software Tools for Population Genetic Analyses (Miller, 1997). The similarity index (SI) values between the RAPD profiles of any two individuals on the same gel were calculated using the formula, SI = 2NAB/(NA + NB) where NAB is the total number of RAPD bands shared by individuals A and B, and NA and NB are the number of bands scored for each individual, respectively (Lynch, 1990). Within population similarity (Sij) was calculated as the average of SI across all possible comparisons between individuals within a population. Similarity between populations (Sij) was calculated as the average similarity between randomly paired individuals from populations i and j (Lynch, 1991). The six primers OPA-10, OPA-11, OPA-19, OPC-01, OPD-11, and OPD-19 were employed to perform the amplification reactions. All primers generated a high number of bands (Table 1). The six primers generated 98 bands, of which 98% were polymorphic. The RAPD profiles of the different primers are shown in the Figures 2, 3 and 4. The genetic distances were calculated according to Nei (1978) (Table 2). The highest genetic distance value (0.394) was found between Yamuna and Narmada at Allahabad and Bhadbhud, respectively. The lowest genetic distance value (0.213) was found between Allahabad and Lalgola.
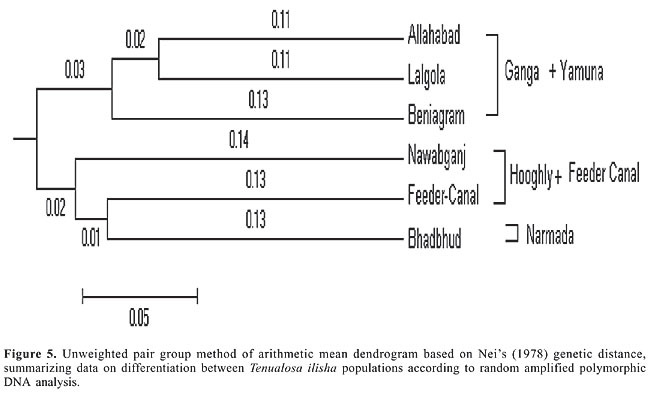
The UPGMA dendrogram based on Nei’s (1978) genetic distance indicated the segregation of the Tenualosa ilisha populations collected from six different sites into two clusters. The populations from Allahabad (Yamuna), Beniagram (Ganga) and Lalgola (Ganga) belonged to one cluster, and those from the Feeder Canal, Nawabganj (Hooghly) and Bhadbhud (Narmada) belonged to the other (Figure 5). The average genetic distance value for the two groups was 0.319. The within group average genetic distance for the Ganga cluster was 0.240 and for the Hooghly cluster it was 0.277. Differences were observed within the two clusters for each population. The overall average genetic distance in all the six locations was 0.295. The gene diversity across all populations for all RAPD loci under study was (mean ± SD) 0.313 ± 0.140. The Fst value within the Ganga was 0.469 and within the Hooghly it was 0.546. The overall Fst value for the six populations examined was 0.590. The Mantel test (Mantel, 1967; Sokal, 1979) was used to determine the extent of genetic differentiation between the Ganga, Hooghly and Narmada samples. The differences among the three river populations were found to be highly significant (P = 0.001).
DISCUSSION The RAPD technique consists of amplification by PCR, of random segments of genomic DNA using a single-short primer of arbitrary sequence. There is no requirement of prior knowledge of the sequence information and its cost effectiveness provides an advantage in population genetic studies. RAPD technique has been applied to the study of phylogenetic relationships in tilapiine and cichlid species (Bardakci and Skibinski, 1994). The technique was found to be useful in reconstructing cichlid fish phylogeny (Sultmann et al., 1995). RAPD has been used in the identification of largemouth bass subspecies and its intergrades (Williams et al., 1990; Welsh and McClelland, 1990), and for the study of Atlantic coast striped bass (Bielawski et al., 1995). The RAPD technique demonstrated low levels of polymorphism among strains of channel catfish, Ictalurus punctatus and Blue catfish Ictalurus furcatus, but polymorphism between them was shown to be higher (Liu et al., 1999). Genetic differentiation within and among sea bass D. labrax from different locations using RAPD showed high levels of polymorphism (Caccone et al., 1997). Thus, RAPD has been used in population studies in fisheries, and can be used efficiently for geographic analysis of populations with differential degrees of geographic isolation. The hilsa fishery is a commercially important fishery in West Bengal, India. The genetic stock structure in the Ganga, Yamuna, Hooghly, and Narmada Rivers has not been studied. Genetic stock structuring will help in better management of the hilsa fishery. The RAPD analysis discriminated the six populations of Tenualosa ilisha from the rivers draining into the Bay of Bengal in the eastern region of India and the Arabian Sea in the west. The RAPD fragments observed in the 72 individuals showed a high degree of polymorphism within and between the populations. The population specific bands could not be discerned from the fragment patterns generated. The cluster diagram delineated the six different populations into two major clusters, which could be due to different spawning grounds of hilsa. Within cluster differentiation was also evident from their genetic distances. The lowest genetic distance (0.213) was found between the Allahabad and Lalgola populations and the highest (0.394) was found between the Allahabad and Bhadbhud populations, indicating that the difference is due to isolation by distance. The population of the Narmada River, which drains into Arabian Sea, clustered with that of the Hooghly suggesting that the hilsa fish is able to migrate along peninsular India and transfer the gene pool to its western population. These findings are in conformity with the observation of two or more races of hilsa in the Bay of Bengal, which ascend the Ganga and Hooghly Rivers for spawning purposes (Jenkins, 1938; Raja, 1985). The recognition of three ecotypes inhabiting the brackish, muddy and freshwater of rivers by Mojumdar (1939), the differentiation into three stocks using biometrical studies by Pillay et al. (1963) and the morphology-based differentiation into broad and slender morphotypes by Ghosh et al. (1968) and Quddus et al. (1984) support the results presented here. Pillay et al. (1963) studied samples from different habitats in India and showed that for each major river system, the stocks of the Ganga, Padma, Chilka Lake, Godavari, and Saurashtra coast can be distinguished from the hilsa of the Hooghly River. The local fishermen and fish traders distinguish hilsa from different river systems in India based on taste preferences. Dahle et al. (1998) used RAPD to differentiate three populations collected from the saline, brackish and freshwater regions of Bangladesh. The mean estimated similarity between Chandpur/Cox’s bazar was 0.403 ± 0.070, Chandpur/Barguna was 0.419 ± 0.072 and Cox’s bazar/Barguna was 0.409 ± 0.067. The average mean similarity between all these locations was 0.410 ± 0.069, which is similar to our findings. Similarly, Shifat et al. (2003) used RAPD to discriminate between the hilsa populations from the Padma and Meghna Rivers. The Padma populations were genetically distant from the Meghna populations and within population variability in Padma and Meghna populations was also established. The dendrogram showed two major clusters for the Padma and Meghna Rivers, indicating the existence of two different spawning populations from the Padma and Meghna Rivers, respectively. Lal et al. (2004) used allozymes to study the hilsa populations from the Brahmaputra, Padma, Ganga and Hooghly Rivers, and Feeder Canal. They genotyped the 26 allozyme loci and concluded that the populations from these rivers did not differ significantly though a high level of genetic variation was observed. Similarly, Salini et al. (2004) used allozymes and morphometric analysis to discriminate hilsa populations collected from nine different sites within Bangladesh. They also analyzed samples collected from India, Indonesia, Malaysia, and Kuwait. Significant differences in allele frequencies were not detected in populations within Bangladesh (Fst = 0.007) or within the Bay of Bengal (Bangladesh, Southeastern India and Myanmar). Significant differences in allele frequencies occurred among Kuwait, Bangladesh and Indonesia. This could be due to isolation of the hilsa populations by distance. They also suggested that the morphological variation in hilsa is due to the local environments. The present study shows the existence of genetic variation within and between the hilsa populations of four inland rivers of India, indicating the presence of separate stocks or races of hilsa that may be due to the river ecology, spawning grounds, nursery grounds of the juveniles, seasonal migration, and homing behavior of anadromous clupeids. The overall Fst found in hilsa falls within the range reported for other migratory fish species (0.56 for Gulf and 0.44 for striped bass; Bielawski et al., 1995). The extensive geographic distribution, long distance migrations, anadromous life histories, and strong homing instincts of anadromous fishes are major determinants in the population structuring of hilsa. Once the population structure is known, scientific management for optimal harvest and conservation of the hilsa fishery resource can be undertaken. In capture fishery, high exploitation combined with poor fishery management results in depletion of the fishery stocks. There are many examples (Begg and Waldmandel, 1999) viz. anchovy Engraulis ringens (Hilborn and Walters, 1992), capelin Mallotus villosus (Tjelmeland and Bogstad, 1993), Atlantic cod Gadus morhua (Hutchings, 1996), orange roughy Haplostethus atlanticus (Smith et al., 1991), and sardine Sardinops sagax (Shannon et al., 1999). Such depletions can result in the loss of the total gene pool (Nelson and Soule, 1987; Smith et al., 1991). Disregard of stock structure in fisheries management can also lead to significant changes in the biological characteristics of a fish species (Altukhov, 1981; Ricker, 1981). Although RAPD, a dominant marker, was used in the present study, which does not differentiate between the homozygote and the heterozygote, it nevertheless provides baseline information on the population structure of hilsa from the Ganga, Yamuna, Hooghly, and Narmada Rivers. The differences in the Fst values determined using the co-dominant allozyme makers and dominant RAPD marker suggest that further studies using mitochondrial and microsatellite markers will further enhance our understanding of the genetic stock structure of hilsa. ACKNOWLEDGMENTS The authors are thankful to Dr. K.K. Vass, Director CIFRI, Barrackpore, and The Head of Division, Fish Health and Environment, CIFRI, for providing the necessary facilities and constant encouragement to pursue the present study. REFERENCES Altukhov YP (1981). The stock concept from the viewpoint of population genetics. Can. J. Fish. Aquat. Sci. 38: 1523-1538. Bardakci F and Skibinski DO (1994). Application of the RAPD technique in tilapia fish: species and subspecies identification. Heredity 73: 117-123. Begg GA and Waldman JR (1999). An holistic approach to fish stock identification. Fish. Res. 43: 35-44. Bielawski JP, Noack K and Pumo DE (1995). Reproducible amplification of RAPD markers from vertebrate DNA. Biotechniques 18: 856-860. Caccone A, Allegrucci G, Fortunato C and Sbordoni V (1997). Genetic differentiation within the European Sea Bass (D. labrax) as revealed by RAPD-PCR. J. Hered. 88: 316-324. Chonder SL (1999). Biology of finfish and shellfish. SCSC Publishers, Howrah. Dahle G, Rahman M and Eriksen AG (1998). RAPD fingerprinting used for discriminating among three populations of Hilsa shad (Tenualosa ilisha). Fish. Res. 32: 263-269. Day F (1873). Report on the freshwater fish and fisheries of India and Burma. Superintended of Government Press, Calcutta. Ghosh AN, Bhattacharya RK and Rao KV (1968). On the identification of the sub-populations of Hilsa ilisha (Ham.) in the Gangetic system with a note on their distribution. Proc. Nat. Inst. Sci. B 34: 44-57. Hilborn R and Walters CJ (1992). Quantitative fisheries stock assessment. Choice, dynamics and uncertainty. Chapman and Hall, New York. Hutchings JA (1996). Spatial and temporal variation in the density of northern cod and a review of hypotheses for the stock’s collapse. Can. J. Fish. Aquat. Sci. 53: 943-962. Jenkins JT (1938). Spawning of the hilsa. Curr. Sci. 7: 251-252. Lal KK, Kumar D, Srivastava SK, Mukherjee A, et al. (2004). Genetic variation in Hilsa shad (Tenualosa ilisha) population in River Ganges. Indian J. Fish. 51: 33-42. Liu ZJ, Li P, Argue B and Dunham RA (1999). Random amplified polymorphic DNA markers: usefulness for gene mapping and analysis of genetic variation of catfish. Aquaculture 174: 59-68. Lynch M (1990). The similarity index and DNA fingerprinting. Mol. Biol. Evol. 7: 478-484. Lynch M (1991). Analysis of population genetic structure by DNA fingerprinting. In: DNA fingerprinting approaches and applications (Burke T, Dolf G, Jefferys AJ and Wolf R, eds.). Basel Institute of Immunology, Basel, 113-126. Mantel N (1967). The detection of disease clustering and generalized regression approach. Cancer Res. 27: 209-220. Miller MP (1997). Tools for population genetic analysis (TPFGA) version 1.3. A Windows program for analysis of allozyme and molecular population genetic data. Computer software distributed by the author. Mojumdar CH (1939). Culture of hilsa. Mod. Rev. 66: 293-295. Nei M (1978). Estimation of average heterozygosity and genetic distances from small number of individuals. Genetics 89: 583-590. Nelson K and Soule M (1987). Genetical conservation of exploited fishes (Ryman N and Utter F, eds.). University of Washington Press, Seattle, 345-368. Pillay TV and Rosa H (1963). Synopsis of biological data on Hilsa, Hilsa ilisha. FAO, Fish. Biol. Synop. 25: 1-6. Pillay TV, Pillay SR and Ghosh KK (1963). A comparative study of the populations of Hilsa, Hilsa ilisha (Hamilton) in the Indian water. Proc. Indo-Pacific Fish. Coun. 10: 63-104. Quddus MM, Shimizu AM and Nose Y (1984). Meristic and morphometric differences in two types of Hilsa ilisha in Bangladesh waters. Bull. Jpn. Soc. Sci. Fish. 50: 43-49. Raja BT (1985). A review of the biology and fisheries of Hilsa ilisha in the upper Bay of Bengal. Bay of Bengal Programme. BOBP/WP/37. Marine Fishery Resource Management in the Bay of Bengal, 66. Ricker WE (1981). Changes in the average size and average age of Pacific salmon. Can. J. Fish. Aquat. Sci. 50: 1924-1933. Salini JP, Milton DA, Rahman MJ and Hussain MG (2004). Allozyme and morphological variation throughout the geographic range of the tropical Hilsa shad, Tenualosa ilisha. Fish. Res. 66: 53-69. Sambrook J and Russell DW (2001). Molecular cloning - A laboratory manual. Cold Spring Harbor Laboratory (CSH), Cold Spring Harbor. Shannon LV, Beacham TD, Seeb L and White BA (1999). Managing fisheries using genetic data: case studies from four species of Pacific salmon. Fish. Res. 43: 45-78. Shifat R, Begum A and Khan H (2003). Use of RAPD fingerprinting for discriminating two populations of Hilsa shad (Tenualosa ilisha Ham.) from inland rivers of Bangladesh. J. Biochem. Mol. Biol. 36: 462-467. Smith PJ, Francis RI and McVeagh M (1991). Loss of genetic diversity due to fishing pressure. Fish. Res. 10: 309-316. Sokal R (1979). Testing statistical significance of geographical variation patterns. Syst. Zool. 28: 227-232. Sultmann H, Mayer WE, Figueroa F, Tichy H, et al. (1995). Phylogenetic analysis of cichlid fishes using nuclear DNA. Mol. Biol. Evol. 12: 1033-1047. Tjelmeland S and Bogstad B (1993). The Barents Sea capelin stock collapse: a lesson to learn. In: Risk evaluation and biological reference points for fisheries management (Smith SJ, Hunt JJ and Rivard D, eds.). NRC Department of Fisheries and Oceans, Ottawa, 127-139. Welsh J and McClelland M (1990). Fingerprinting genomes using PCR with arbitrary primers. Nucleic Acids Res. 18: 7213-7218. Williams JG, Kubelik AR, Livak KJ, Rafalski SV, et al. (1990). DNA polymorphisms amplified by arbitrary primers are useful as genetic markers. Nucleic Acids Res. 18: 6531-6535. Yeh FC, Yang RC and Boyle T (1999). POPGENE, version 1.31. Microsoft windows based freeware for population genetic analysis. (http://www.ualberta.ca/~fyeh/fyeh). |
|
