![]()
![]()
![]()
![]()
![]()
![]()
![]()
![]()
![]()
![]()
![]()
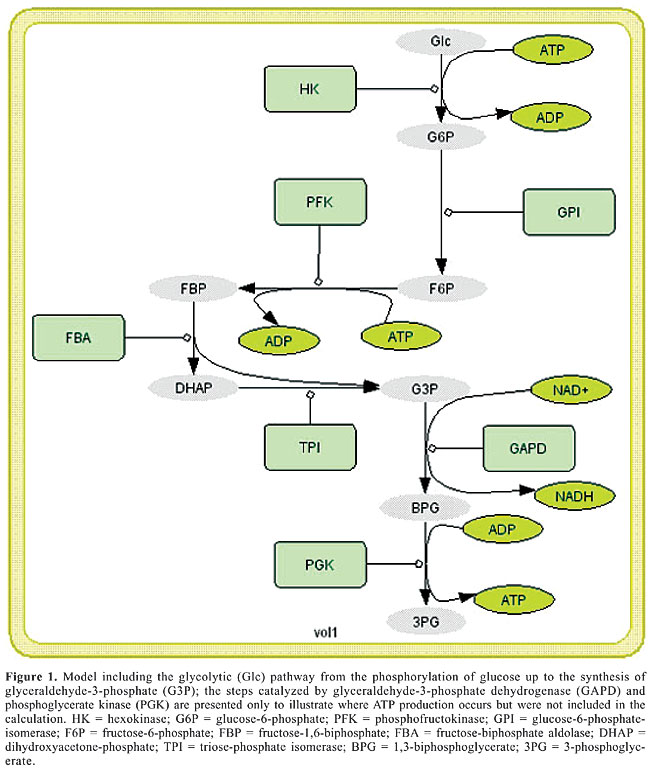
ABSTRACT. The present study compares two computer models of the first part of glucose catabolism in different organisms in search of evolutionarily conserved characteristics of the glycolysis cycle and proposes the main parameters that define the stable steady-state or oscillatory behavior of the glycolytic system. It is suggested that in both human pancreatic b-cells and Saccharomyces cerevisiae there are oscillations that, despite differences in wave form and period of oscillation, share the same robustness strategy: the oscillation is not controlled by only one but by at least two parameters that will have more or less control over the pathway flux depending on the initial state of the system as well as on extra-cellular conditions. This observation leads to two important interpretations: the first is that in both S. cerevisiae and human b-cells, despite differences in enzyme kinetics and mechanism of feedback control, evolution seems to have kept an oscillatory behavior coupled to the glucose concentration outside the cytoplasm, and the second is that the development of drugs to regulate metabolic dysfunctions in more complex systems may require further study, not only determining which enzyme is controlling the flux of the system but also under which conditions and how its control is maintained by the enzyme or transferred to other enzymes in the pathway as the drug starts acting. Key words: Glycolysis, b-cell, Oscillations, Computer simulation, Robustness, Insulin INTRODUCTION Nowadays, there are several different computer models available for the simulation of metabolic networks and many have been compared to experimental data for validation. Most computer models are built based on data recovered from articles reporting experimental results on isolated enzymes (most of them in vitro) and are expected to provide a simulated behavior comparable to the real behavior of metabolism in the living system. Because of its broad physiological implications, glycolysis is one of the best studied metabolic pathways. Metabolic control analysis (Burns and Kacser, 1973) has been widely used to identify the steps in a metabolic network that control its flux through a rate-limiting effect. However, most metabolic control analysis tools only handle steady-state systems and cannot evaluate the rate-limiting enzyme in limit cycles. Robustness is the ability to maintain stable functioning despite various perturbations (Kitano, 2004). A complex system is usually a compromise between an external robustness (i.e., tolerance to modifications in the external environment) and internal fragility (i.e., an intense dependency on the correct functioning of its internal components). This trade-off can be seen, for example, in a fly-by-wire airplane that can be as easily maneuvered amid a storm as in a blue sky but will fall like a rock in case of malfunction of its electronic devices. This study reports results on the control analysis of two glycolysis models recovered from articles previously published, one for Saccharomyces cerevisiae (Termonia and Ross, 1981; Teusink et al., 2000) and another for human pancreatic b-cells (Westermark and Lansner, 2003). Through variation of parameters and time course analysis, the controlling steps of the metabolic network were identified and their effects on system behavior were recorded. These results allowed us to address whether the currently available mathematical models of glycolysis indicate the occurrence of robustness, and whether robustness has been conserved among different species even though the “components” of the system (enzymes, compartments, organelles, etc.) diverged over the course of evolution. MODEL AND KINETIC EQUATIONS The glycolytic metabolic pathway upon which the models were based is depicted in Figure 1. The models and kinetic equations adopted for S. cerevisiae were as previously published by Teusink et al. (2000) and Termonia and Ross (1981). Models and kinetic equations for human pancreatic b-cells were as in Westermark and Lansner (2003).
In the present study, models were written in terms of their differential equations using Jarnac 2.16g (Sauro et al., 2003), which can be summarized as follows: 1. Glc + ATP Þ G6P + ADP: Hill equation, saturated by MgATP; 2. G6P Û F6P: fast equilibrium with [F6P] = 0.3*[G6P]; 3. F6P + ATP Þ FBP + ADP:
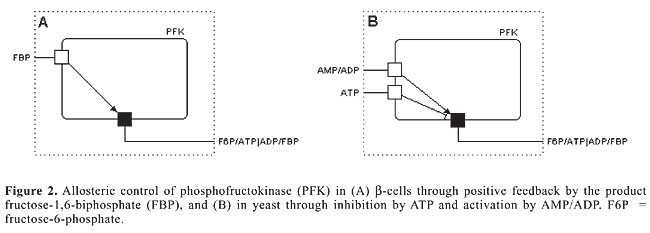
4. FBP Þ DHAP + G3P: Michaelis-Menten standard reaction; 5. DHAP Û G3P: fast equilibrium with [DHAP] = 22*[G3P]; where Glc = glucose; G6P = glucose-6-phosphate; F6P = fructose-6-phosphate; FBP = fructose-1,6-biphosphate; DHAP = dihydroxyacetone-phosphate; G3P = glyceraldehyde-3-phosphate. Glucose transport is usually not considered to have a regulatory role because the amount of glucose transported is in vast excess of what can be metabolized. The largest differences between the yeast and human b-cell models are with respect to the regulation of phosphofructokinase (PFK). In yeast, the regulation of this enzyme is handled by the negative feedback of ATP and positive feedback of either AMP or ADP (Termonia and Ross, 1981).The regulation of PFK in b-cells, on the other hand, is suggested to be controlled by the product of the reaction, FBP (Westermark and Lansner, 2003). The different possibilities for allosteric regulation of the PFK enzyme are schematically presented in Figure 2.
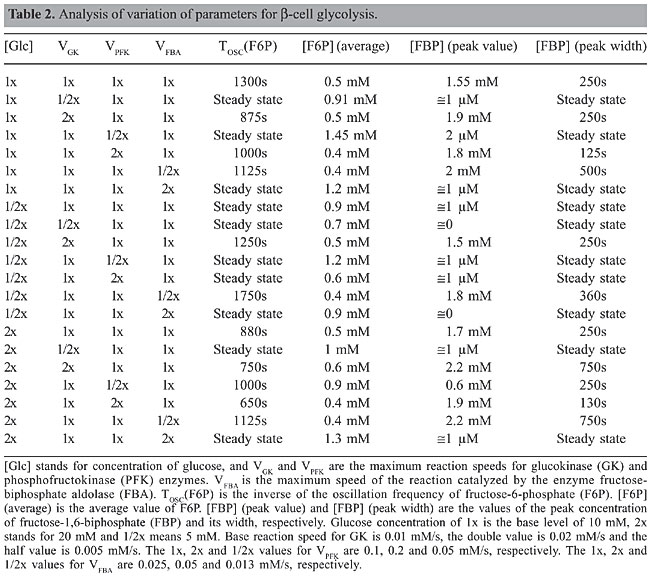
Time course simulations were carried out to evaluate the behavior of the system. Values were scanned using three different concentrations of glucose: 50% of normal concentration (called hypoglycemia in the case of b-cells), normal and 200% of normal concentration (hyperglycemia). The activities of the enzymes varied from 50 to 200% of their maximum rate. The influence of these variations was evaluated with respect to the pattern of oscillation of the system as well as to the concentrations of the different enzymatic products. In order to evaluate a possible effect of oscillations on the cell’s phosphorylation potential, the ATP/ADP ratio was calculated as well as the ratio between the quantity of molecules in the ATP-consuming part of the metabolic network (synthesis of F6P and FBP; Figure 1) and in the ATP-generating part (synthesis of 3-phosphoglycerate (3PG); Figure 1, and pyruvate (PYR), not shown) estimated as the ratio of F6P to PYR (in cases of oscillation the average value was used). In the analysis of the model for b-cells, the ratio of ATP to ADP was not used since for this model a simplification suggests that this ratio would not affect the activity of the PFK enzyme (Westermark and Lansner, 2003). RESULTS AND DISCUSSION Parameters controlling the oscillatory behavior Our first approach was to analyze the models in search of the oscillatory controlling parameters (enzyme activities and metabolite concentrations) by modifying their values while leaving the rest of the model unchanged and by searching for qualitative modifications in the system’s behavior. Once identified, their values were scanned to find the bifurcation points where the oscillatory behavior starts. The values found, as well as their effects, are presented in Tables 1 and 2.
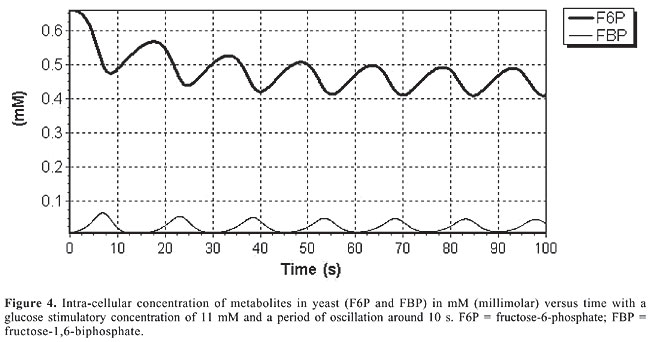
In S. cerevisiae, these results show that the oscillatory behavior depends on Glc concentration, on glucokinase (GK) activity, on the PFK maximum speed, as well as on the value of the forward reaction constant of the reversible reaction between FBP and G3P. In human b-cells, oscillations are only possible if the concentration of Glc and the maximum reaction speeds of the enzymes PFK and GK are within a specific interval of values. This seems to indicate that the oscillatory behavior of glycolysis in b-cells is under selective pressure. The differences in the control of glycolysis lead to two different flux dynamics in the system: in b-cells glycolysis behaves as a series of peaks (Figure 3), while in yeast it is more like a smooth-controlled oscillation (Figure 4).
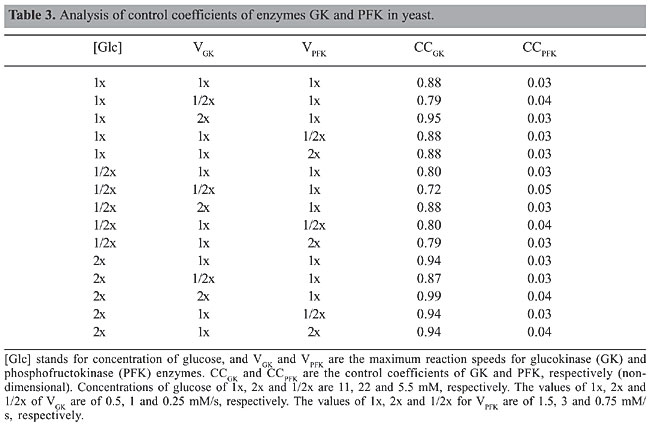
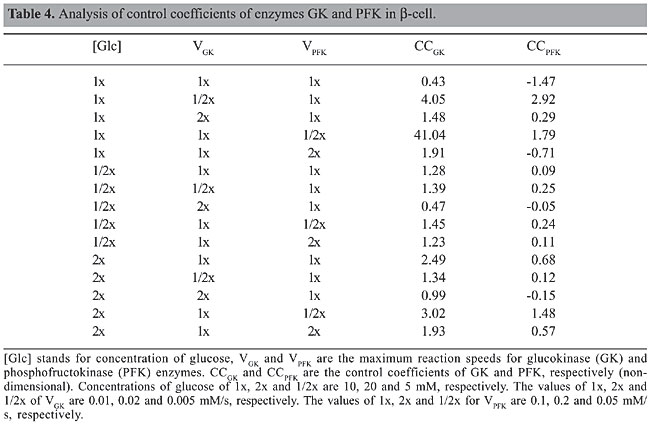
Several exploratory conclusions may be drawn by analyzing Tables 1 and 2. Regarding robustness, it is noteworthy that in yeast the glycolytic system is focused on the maintenance of energy levels in the cell (negative regulation of PFK by ATP) and thus the ability to limit the conversion of glucose into energy in situations where it is not needed. Therefore, it would be more advantageous to store it or deviate the flux towards other cell cycle activities such as cell division. If a similar situation occurred in b-cells, it would instead lead to a burst in PFK activity that would tend to consume the extra supply of glucose, a strategy that shows the commitment of these cells to controlling blood glucose levels and a particular specialization in sensing high levels of glucose. Both in yeast and b-cells, decreases in the activity of the enzymes GK and PFK lead to loss of oscillations and reduction of flux, but increases in the activity of GK in both cells are buffered up to a certain level (5 times in b-cell and 1000 times in yeast), which means that mutations increasing GK activity in yeast would not lead to a noticeable modification in metabolism. A decrease in glycolytic activity after a 4-fold overexpression of GK has been observed experimentally in b-cells (Wang and Iynedjian, 1997), thus validating our simulation results. The 5-fold increase in GK activity directs the metabolic flow to a steady state with a flux lower than that observed in hypoglycemic situations, an effect that seems to be due to an increase in the frequency of oscillation of the product FBP up to a point where the system stops responding. Metabolic control analysis A control coefficient is defined as the ratio between the change in the log values for the reaction’s flux and the change in the log values for the enzyme activity. A control coefficient of 1 means that a change in the activity of that enzyme (and thus on its maximum reaction speed) will lead to a change in the metabolic pathway flux of the same magnitude. In order to identify which enzyme had the greatest influence on the reaction flow, a metabolic control analysis was performed with the enzymes GK and PFK under different conditions of glucose concentration and GK and PFK activities. Even though metabolic control analysis was originally designed for the study of steady-state metabolic fluxes, in this study we used the average value of the metabolites in the case of oscillatory behaviors. The procedure to obtain the control coefficients was to impose a variation of 10% on the enzyme activities and to determine the variation of the average concentration of FBP since this metabolite is produced immediately after the two enzymes studied. The results are presented in Tables 3 and 4.
A comparison of Tables 3 and 4 shows that in yeast most of the control of the metabolic pathway resides in the enzyme GK, while in b-cells this control seems to alternate between the two enzymes (GK and PFK) depending on the conditions considered. This different behavior suggests that a drug treatment or genetic engineering of S. cerevisiae could focus solely on the enzyme GK, while modifications of the b-cell glycolytic pathway would require a much more detailed intervention since the enzyme controlling the reaction is not always the same. Similar studies have been performed for host-pathogen treatment strategies (Bakker et al., 1999, 2000). Experimental studies in b-cells, however, state that the control coefficient of GK should be around 1 even in situations up to 8 times the speed of reaction of wild types. This suggests that the currently accepted model for b-cells may not be correct when large variations in GK kinetics are considered (Wang and Iynedjian, 1997). The comparison of glycolysis models of two different organisms, yeast and human b-cell, leads to the interpretation that despite the different constant values and the different mechanisms of feedback control of the PFK enzyme both systems keep oscillations coupled to the concentration of glucose available and both are fit to keep their oscillations at higher concentrations of glucose as previously determined by experimentation (Wang and Iynedjian, 1997), while neither can maintain the oscillations at concentrations 50% below those commonly used in experiments as normal (@10 mM). Both systems are also fragile in terms of the enzymatic values, since both lose oscillations in case of a 50% reduction in the maximum activity of GK or PFK or a 100% increase in the forward direction of the reaction FBP to G3P. Intriguingly, while yeast can handle increases of up to 1000 times in the speed of GK, b-cells tolerate only a 5-fold increase. An increase of more than 5-fold in the activity of GK in b-cells will lead to a flux smaller than in non-oscillatory conditions with a smaller ATP production and thus smaller peaks of insulin secretion. A lowering of blood insulin levels may lead to a deregulation of glucose homeostasis. Therefore, this result predicts that b-cells may have evolved a tight mechanism for controlling GK levels. Indeed, b-cells have post-transcriptional regulation of GK based on its compartmentalization within the cell (Rolland et al., 2001). It seems that at low levels of glucose, part of GK is sequestered in an inactive state in the nucleus, and as the level of glucose increases these inactive molecules of GK are released and activated. This mechanism has two interesting features, the first is that GK activity (VGK) decreases when there is a lower concentration of glucose and thus its control coefficient becomes even higher in these situations than proposed in the current models. The second feature is that this allows the cell to respond quickly to an increase in the concentration of glucose since the sequestration of GK is mediated by phosphorylation, and thus its re-activation time would be comparable to that of the reaction GK catalyzes. Interestingly, this dynamic is similar to the behavior of PFK itself, because GK increases its catalytic activity (through release of sequestered GK from the nucleus) until glucose is depleted, in which case GK would again be sequestered in the nucleus and glucose concentration would again rise. This manuscript illustrates a strategy of comparing related metabolic pathways by means of computational simulations as a useful approach to pose new hypotheses regarding control mechanisms in biological systems. ACKNOWLEDGMENTS We thank Dr. José Manoel Balthazar, from UNESP (Rio Claro, SP, Brazil), for invaluable insights. We thank Thomas Silva for kindly providing his model for glycolysis and Flavia Fuchs de Jesus for revision of the manuscript. A.S. Silva was the recipient a graduate fellowship from CAPES. Supplemental material The models used in this article are freely available for both Matlab and SBW/Jarnac platforms at http://www.i-genics.com. REFERENCES Bakker BM, Walsh MC, ter Kuile BH, Mensonides FI, et al. (1999). Contribution of glucose transport to the control of the glycolytic flux in Trypanosoma brucei. Proc. Natl. Acad. Sci. USA 96: 10098-10103. Bakker BM, Westerhoff HV, Opperdoes FR and Michels PA (2000). Metabolic control analysis of glycolysis in trypanosomes as an approach to improve selectivity and effectiveness of drugs. Mol. Biochem. Parasitol. 106: 1-10. Burns JA and Kacser H (1973). The control of flux. Symp. Soc. Exp. Biol. 27: 65-104. Hofmeyr JH and Cornish-Bowden A (1997). The reversible Hill equation: how to incorporate cooperative enzymes into metabolic models. Comput. Appl. Biosci. 13: 377-385. Kitano H (2004). Cancer as a robust system: implications for anticancer therapy. Nat. Rev. Cancer 4: 227-235. Rolland F, Winderickx J and Thevelein JM (2001). Glucose-sensing mechanisms in eukaryotic cells. Trends Biochem. Sci. 26: 310-317. Sauro HM, Hucka M, Finney A, Wellock C, et al. (2003). Next generation simulation tools: the Systems Biology Workbench and BioSPICE integration. Omics 7: 355-372. Termonia Y and Ross J (1981). Oscillations and control features in glycolysis: numerical analysis of a comprehensive model. Proc. Natl. Acad. Sci. USA 78: 2952-2956. Teusink B, Passarge J, Reijenga CA, Esgalhado E, et al. (2000). Can yeast glycolysis be understood in terms of in vitro kinetics of the constituent enzymes? Testing biochemistry. Eur. J. Biochem. 267: 5313-5329. Wang H and Iynedjian PB (1997). Modulation of glucose responsiveness of insulinoma b-cells by graded overexpression of glucokinase. Proc. Natl. Acad. Sci. USA 94: 4372-4377. Westermark PO and Lansner A (2003). A model of phosphofructokinase and glycolytic oscillations in the pancreatic b-cell. Biophys. J. 85: 126-139. |
|