![]()
![]()
![]()
![]()
![]()
![]()
![]()
![]()
![]()
![]()
![]()
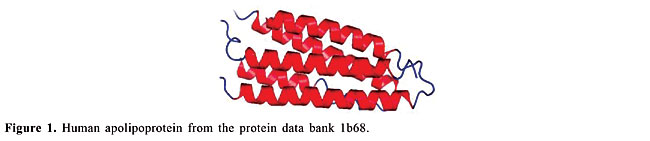
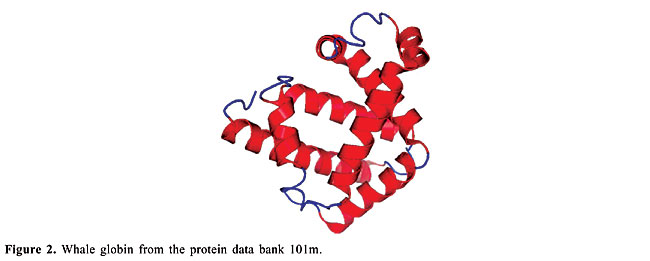
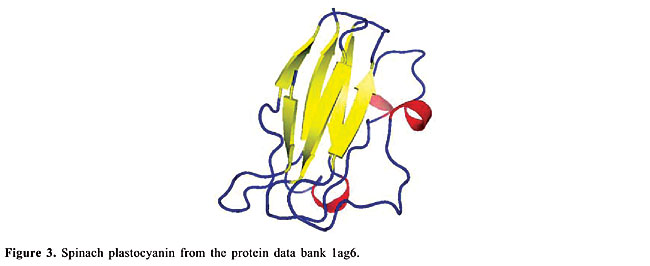
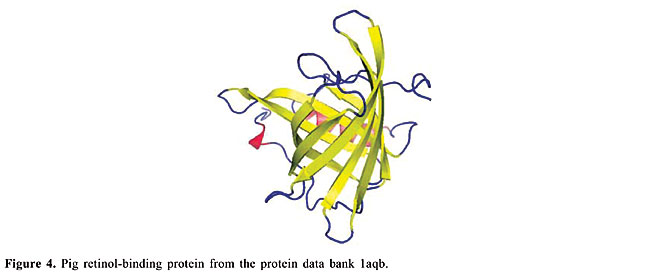
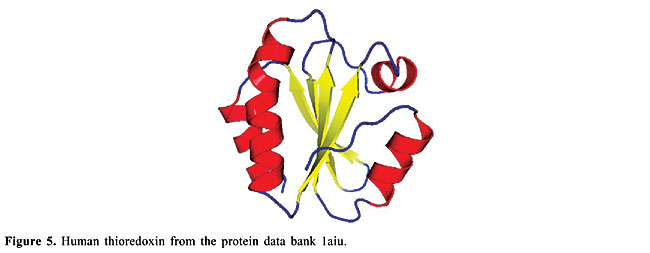
ABSTRACT. We modeled the problem of identifying how close two proteins are structurally by measuring the dissimilarity of their contact maps. These contact maps are colored images, in which the chromatic information encodes the chemical nature of the contacts. We studied two conceptually distinct image-processing algorithms to measure the dissimilarity between these contact maps; one was a content-based image retrieval method, and the other was based on image registration. In experiments with contact maps constructed from the protein data bank, our approach was able to identify, with greater than 80% precision, instances of monomers of apolipoproteins, globins, plastocyanins, retinol binding proteins and thioredoxins, among the monomers of Protein Data Bank Select. The image registration approach was only slightly more accurate than the content-based image retrieval approach. Key words: Protein structure, Image-matching, Image registration, Contact maps, Content-based image retrieval INTRODUCTION Bioinformatics is an emerging field undergoing rapid growth. This growth has mainly been fueled by advances in DNA sequencing and mapping techniques. The Genome Project has resulted in an exponentially growing database of genetic sequences, while the Structural Genomics Initiative is doing the same for the Protein Data Bank (PDB; Berman et al., 2000). One of the most active research areas in bioinformatics is the study of the relation between protein structure and function. Proteins are the most versatile macromolecules in living systems, serving crucial functions in all biological processes. They function as catalysts and transporters, store other molecules, such as oxygen, provide mechanical support and immune protection, generate movement, transmit nerve impulses, and control growth and differentiation. Proteins are composed of sequences of amino acids, which is called primary structure. Different regions of the sequence form organized secondary structures, such as a-helices or b-strands. The tertiary structure, which is the three-dimensional structure of the protein, is formed by packing these structural elements into one or several compact globular units, called domains. The functional properties of proteins depend upon their three-dimensional structures. These structures arise because a particular sequence of amino acids folds to generate domains with specific three-dimensional structure, from a linear chain. It is known that the amino acid chain completely determines the structure of a protein. However, many proteins can have the same structure and the same function, but with very little sequence identity or similarity (see Gan et al., 2002). The study of a protein structure is very important, because the structure determines the protein function. In Figures 1-5, we present five proteins with different topologies.
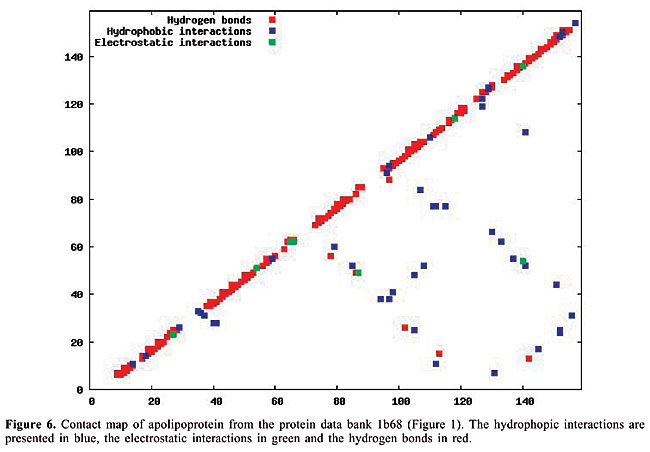
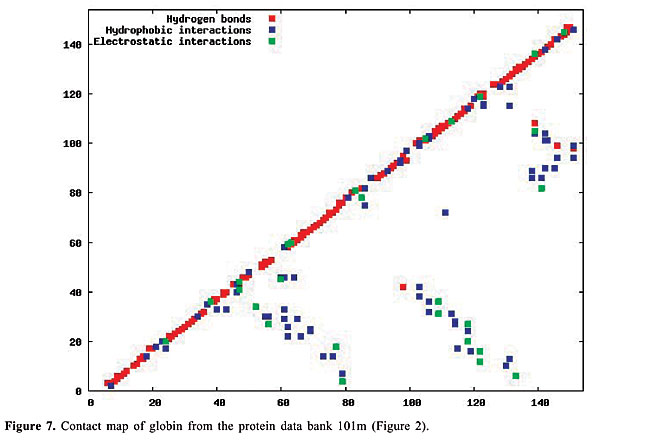
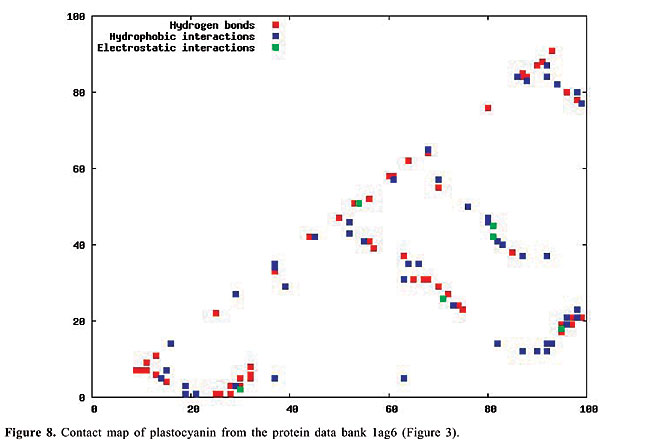
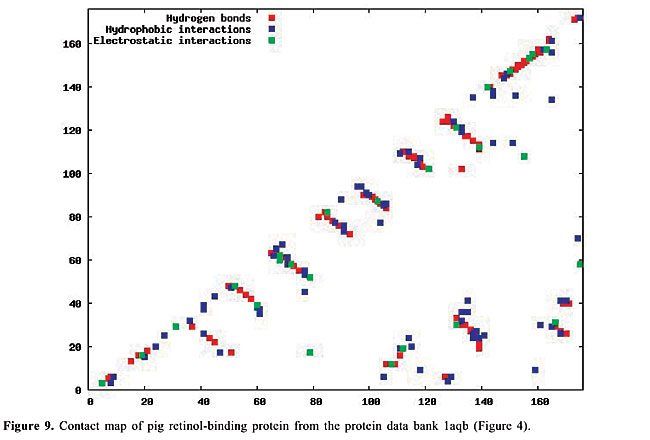
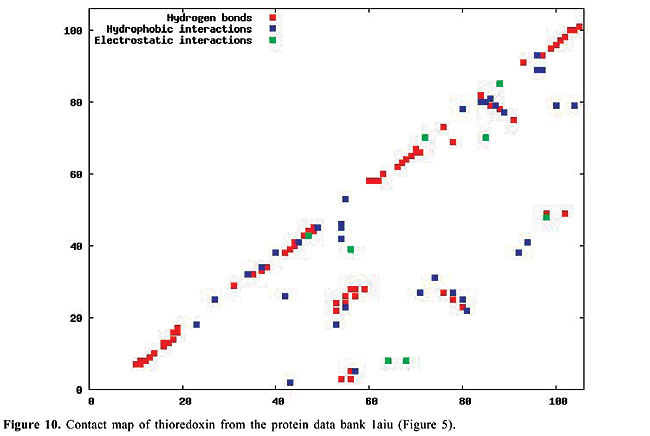
By January 2005, the PDB had approximately 29,000 proteins in its archives; this number is increasing continuously. In 2004, approximately 5,000 proteins were added. Even though the PDB is now a huge data set, considerable information still needs to be added, especially concerning protein structure. The inter-residue chemical interactions are very important for the folding of a protein and for keeping its shape once it is folded. Each protein family presents a specific pattern of contacts that we believe can produce a structural signature for that family. Here, we have used the traditional contact maps and an image-matching approach to analyze the similarity of protein structures. We selected proteins with different topologies, and we used PDB Select (Hobohm et al., 1992; Hobohm and Sander, 1994) to evaluate the performance of this approach. The PDB Select database is a subset of the structures in the PDB that does not contain (highly) homolog sequences. For each selected protein, we built the respective contact map, which is an image in which the colors represent types of chemical interactions between two amino acids. These contact maps are a two-dimensional representation of the protein structure. Content-Based Image Retrieval (CBIR) and Image Registration (IR) techniques are used to measure the dissimilarity between contact maps, making it possible to measure the similarity between protein structures. In fact, a chain folds in a three-dimensional structure because of chemical interactions between its amino acids. These interactions are also indispensable for the action of the proteins. In the enzymes, for example, they are responsible for the binding of the substrate, and they are involved in catalysis as well. Thus, it is as important to study the similarity of proteins based on their internal chemical interactions, as it is to find a pattern of chemical interactions for each protein family. The three most important kinds of interactions are hydrophobic, electrostatic and hydrogen bonds: · The hydrophobic interactions consist of the attraction between hydrophobic side chains of residues of amino acids because of their water aversion. This makes water-soluble proteins fold in a hydrophobic core and a hydrophilic surface. · The electrostatic interactions are the attraction or repulsion between amino acids with different or equal charges. Most of them are located on the surface of the proteins. · The hydrogen bonds are strong, short-distance interactions between amino acids that share a common hydrogen atom. They are very important to stabilize the a-helices and the b-strands, structures that maintain the folding of the protein (Branden and Tooze, 1999). We used the spatial location of these three types of interactions as the features from which protein structure is identified. Structural comparison is a central task in biomedical research. Identifying structural similarities can provide significant insights into the relation between structure and function in proteins. Reliable and efficient structural matching plays a key role in rational drug design and in assessing the structure prediction methods. Other applications of protein structure analysis include validation of protein models, identification of native folding motifs among incorrect alternatives, identification of possible folds for a sequence of unknown structure, and finding sequences compatible with given structures. RELATED STUDIES Protein structure has been a topic of great interest during recent years. Some researchers have explored the positioning of the secondary structures to classify protein structures; others work on atomic detail and try to develop templates for each protein family. There is also some research on contact maps, in an attempt to align protein pairs structurally. TOPS (Westhead et al., 1998) is a web site for protein structure classification. It presents an atlas of drawings representing the structure of proteins. These are two-dimensional schemes that display a fold as a sequence of secondary structures, along with their relative orientation and spatial position. TOPS performs protein classification, based on pattern searching, using a string-graph algorithm. Another method used for the comparison of protein structures is TOPSCAN (Martin, 2000). This system also uses secondary structures and their relative direction, proximity, accessibility, and length. This method uses the Needleman and Wunsch dynamic programming algorithm called Needleman. The CATH (Orengo et al., 1997) database is a hierarchical domain classification of proteins. Structures are grouped into fold families, depending on the shape and connectivity of the secondary structures. This is done using the structure comparison algorithm, SSAP (Orengo and Taylor, 1996). Parameters for clustering domains into fold families were determined by empirical trials throughout the database. SCOP (Murzin et al., 1995) is a web site of protein hierarchy. It was created by manual inspection and abetted by automated methods, aiming to provide a description of the structural and evolutionary relationships between proteins with known structures. In a study on atomic detail (Chew and Kedem, 2002), coordinates of the a-carbons were used to generate a signature for each protein, and a protein consensus was compiled for each family of proteins. Through this consensus, it is possible to analyze the similarity of protein families and also to classify protein structures into families. Gan et al. (2002) also examined atomic detail to analyze the variations in the three-dimensional structures of two proteins through their root mean square values, and they compared their findings with the sequence similarity of these proteins. All of these studies used information on the chemical interactions between residues in the proteins. We believe that each family of proteins presents a specific structural signature that can be extracted from contact map images. With our methodology, we can analyze the similarity of interactions between the molecules. Furthermore, using dissimilarity measurements that are well-defined mathematically and continuously valued, we can measure how much proteins from a single family differ from each other. Lancia (2001) and Carr et al. (2002) used the traditional contact maps to align pairs of proteins structurally. Their maps do not differentiate among types of contacts, while ours do. They attempted to overlap contact maps, mapping contacts of one map to contacts of the other; this overlap gives a score that indicates how many contacts were matched. This score makes it possible to use their methodology for protein classification. However, these algorithms are very expensive computationally. Among the 528 alignments that they examined, only 42 were optimally solved in less than an hour. With our methodology, the dissimilarity between a pair of proteins can be computed in a minute, or even less. MATERIAL AND METHODS The contact maps Contact maps are useful tools to study protein structure. In our system, each contact map consists of a colored image that represents different kinds of chemical interactions between all the amino acids of a protein. Our database is composed of contact map images with n x n pixels, where n is the number of residues of amino acids of the protein sequence. We define the color of each pixel [i,j] as: · white if there is no interaction between amino acids i and j; · blue if there is a hydrophobic interaction; · green if there is an electrostatic interaction, and · red if there is a hydrogen bond. These maps have the limitation that amino acids can have more than one kind of interaction, which cannot be expressed in these two-dimensional images. So, we decided to prioritize the electrostatic interactions, followed by the hydrogen bonds, and finally the hydrophobic interactions. This is the increasing frequency order of these types of contact. Because of the high frequency of the hydrophobic interactions, we believe that ignoring a few of them will not affect the general distribution of these contacts. Also, since the value of n varies from a protein to another, all the images must be normalized to the same dimensions before applying the image-matching algorithms. In Figures 6-10, we present plots of protein chemical interactions as contact map images in our database. These figures came from the proteins presented in Figures 1, 2, 3, 4, and 5, respectively.
With the increasing growth rates of the public protein databases, as observed in the PDB, retrieving relevant proteins from a given query is becoming a difficult task. Current database searches are performed by text query on protein identifications, names and other features, but all of them include analyses of structural similarity. Using contact maps, as visual representations of proteins, allows us to use an image-matching methodology in order to analyze structural similarity between them. Hence, we expect to, given a specific protein, select the protein maps that have similar interaction patterns and thus similar protein structures. The database We can distinguish among different kinds of chemical interactions through the different colors in the images in our database. This is useful because each type of interaction has a different rule in the folding and in the activity of the proteins. The contact maps contain information about the hydrophobic and electrostatic interactions and about the hydrogen bonds, the main interactions that govern the folding of a protein. The cut-off distances between amino acids used to select the contacts presented in the map were [2.0, 3.8] Å for hydrophobic contacts, [2.0, 6.0] Å for the electrostatic interactions and [2.0, 3.2] Å for the hydrogen bonds. There are other kinds of contacts that we intend to analyze in the future. All biological data came from the PDB. The contact maps were generated using a module of STING (Neshich et al., 2003). To test the performance of our approach, we selected all the monomers with five different protein topologies from the PDB. We selected the globins, which are the oxygen carriers in the muscles and the blood and which are very well-studied proteins. This family of proteins is composed only of a-helices. There are 224 globins in the PDB. We also used the 13 apolipoproteins, which are lipoproteins composed of bundled a-helices. The plastocyanins are electron transporters, composed mostly of b-sheets. We found 15 of them in the PDB. Another family used is the retinol-binding proteins (RBP), which are also composed of b-sheets, but are barrel shaped. There are actually 18 of them in the PDB. Finally, we used the thioredoxins, which are electron transporters composed of both a-helices and b-sheets. We found eight of them in the PDB. The identifications of all of this test set are indicated in Table 1.
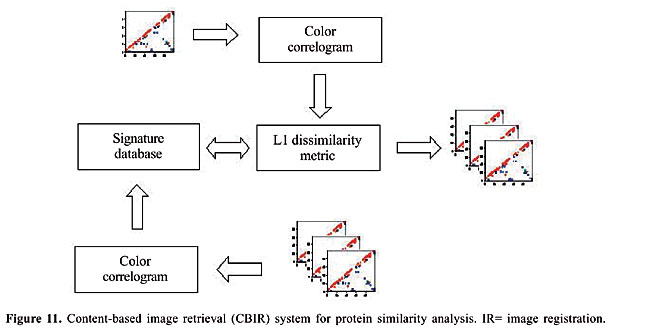
Table 2 is available at http://www.funpecrp.com.br/gmr/year2006/vol2-5/pdf/gmr0191table2.pdf. Our objective was to retrieve all proteins of similar structures, within a mixture with other proteins of different topologies. We tested this with 187 proteins of different topologies. These proteins are all monomers of the PDB Select list (Table 2). Image-matching methodology We examined how different image-matching approaches may be used to compute measures of structural similarity between two arbitrary proteins from their contact maps. In particular, we consider two conceptually distinct ways of treating this problem: as a CBIR problem or as a problem of IR. CBIR is a scientific discipline largely based on the notion that it is ideally possible to perform some form of semantics-preserving compression (Pentland et al., 1994) of each image in a database into a signature vector, which should be as small as possible to maximize the efficiency of image-based queries to the database later on. Usually, such signature vectors are computed from low-level primitives and their perceptual groupings (Mojsilovic et al., 2004), i.e., from attributes that can be measured directly in images, such as color, texture and geometric primitives (lines, segments, curves, boundaries, junctions, etc.), and their spatial relationships in the image, which convey higher-level semantic cues. A strong motivation to apply CBIR techniques to the protein classification problem is the growing size of protein databases such as the PDB. Even though indexing such large databases can be a costly operation, it may be done incrementally, and once it is finished, queries to the database are answered very efficiently. On the other hand, in spite of the fact that semantics-preserving encoding of complex protein structural properties into very small vectors is possible (that is what the primary structure is), it is not clear that performing such encoding directly from the contact maps is a computationally feasible problem. Thus, alternatively, we propose a means of measuring how dissimilar any two proteins are based on the cost of registering the images formed by their contact maps. The IR paradigm (Brown, 1992) is often used to match multiple images of a single object that suffers non-rigid deformations (Maintz and Viergever, 1998). A cost is attributed to each deformation that the object may suffer and the image-to-image dissimilarity is computed by finding the lowest-cost deformation that maps one image onto the other. A motivation to apply this idea to contact maps is that distinct proteins evolved from common ancestral molecules, and consequently proteins with the same structure (thus similar contact maps) can be more than 80% different in their amino acid composition. Thus, if we can somehow model the “deformations” needed to “warp” a contact map into another, as a sequence of simple transformations that mimic the effects of evolutionary changes in protein structure, the structural dissimilarity between any two proteins can be computed by finding the minimum-cost sequence of such transformations between their contact maps. This proposed methodology was tested with two techniques from different paradigms; there are trade-offs in the choice between them. Like feature-based methods, CBIR techniques tend to be more efficient with very large data sets, but on the other hand, like direct methods, IR techniques tend to be more accurate, at least in terms of matching pairs of images that are indeed closely related. The content-based image retrieval approach In order to fully specify a CBIR algorithm, it is necessary to define how the signature vector of each possible image is generated and how the dissimilarity between two arbitrary vectors is computed (Del Bimbo, 1999). Figure 11 presents a schematic representation of our proposed CBIR system.
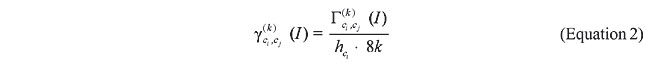
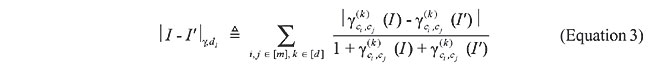
We used the Color Correlogram (Huang et al., 1997) as the image signature, the d1 distance measure for dissimilarity analysis and image-based queries as input to the system. The Color Correlogram expresses how the spatial correlation of pairs of colors changes with distance. It specifies the probability of finding a pixel of color j at distance k from a given pixel of color i. Let I be an n x n image with a color space quantized into m colors c1,…, cm. Also let a distance d £ n be fixed a priori. Then, the correlogram of I is defined for i, j Î [m], k Î [d] as:
where the notation p1 Î Ii means that the color of pixel p1 in image I is ci, i.e., that p1 Î I, I(p1) = ci. To compute the correlogram we have to evaluate the following equation:
where hci is the color histogram value of ci and
The d1 measure is known to be relatively insensitive to the contents of individual vector elements. Instead, it corresponds to a weighted average of discrepancy across the entire set of features in the image signatures. In the case of the correlograms of two images I and I’, these weights are inversely proportional to the sum of the correlograms, i.e., the larger this sum is, the smaller is the influence of the pair of colors (ci, cj) in the overall measure. More specifically, the d1 measure for the correlogram of images I and I’ is
where 1 in the denominator avoids division by zero. Importantly, once the color correlograms of two images have been built, the calculation time increases linearly, based on the signature vector size to be computed, which means that queries on large databases are answered efficiently. The image registration approach With IR, it is not necessary to compute a signature for each image, but, as with the Color Correlogram, this method computes a dissimilarity measure between two maps. This methodology is loosely inspired on the Approximate Stereo work of Kutulakos (2000), which introduced an algorithm to match multiple images in a way that is invariant within a class of transformations called shuffle transforms. A shuffle transform is a geometric transformation that causes a repositioning of individual pixels bounded by a dispersion radius, r. More specifically, two images I and I’ are related by an r-shuffle if, and only if, for every pixel in I, there is a pixel of identical color within a disk of radius r in I’. The use of this kind of transformation in the analysis of protein structural similarity is attractive, because its spatially localized nature preserves high-level geometric features, much as evolutionarily feasible changes in a protein’s primary structure do. However, the notion of dispersion radius, as stated above, is not appropriate for our application, because it is a worst-case global property, i.e., if even one pixel in image I does not have an r-radius neighbor on I’, then I and I’ are not related by an r-shuffle. Here, instead, we define the concept of Average Dispersion Radius between two images as the average Euclidean distance between pixels in one image and the closest pixels with the same color in the other image. More formally, the Average Dispersion Radius between two n x n images is defined as:
where
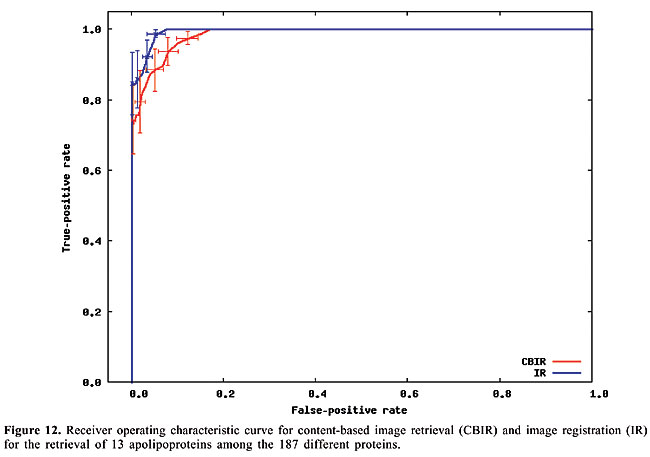
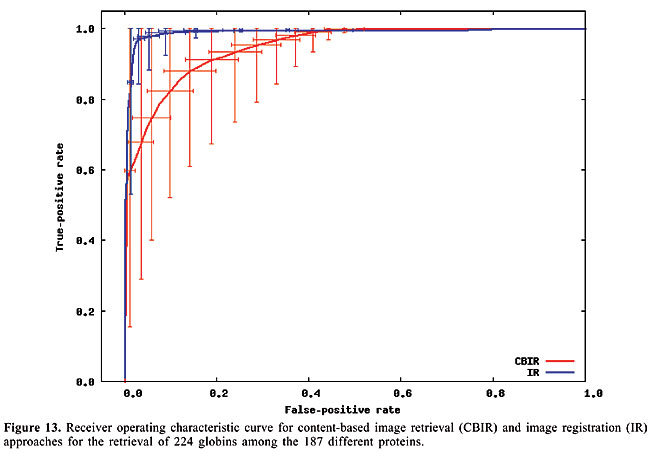
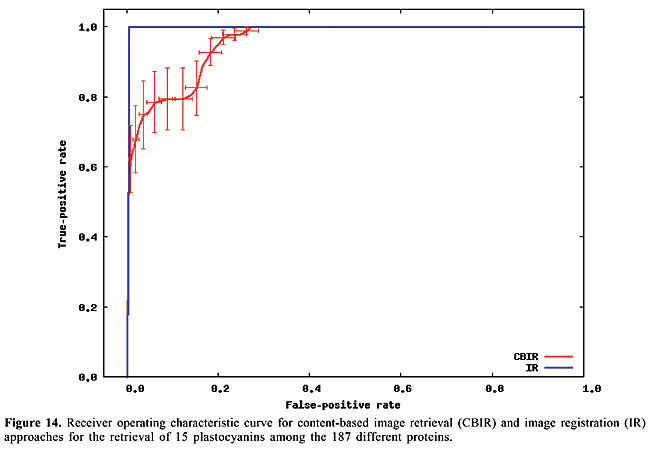
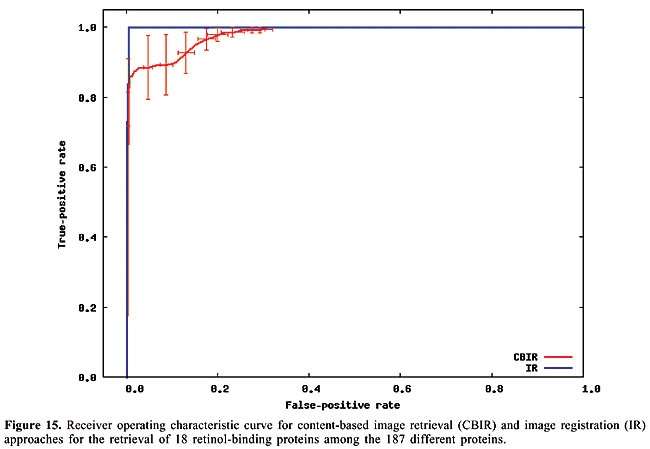
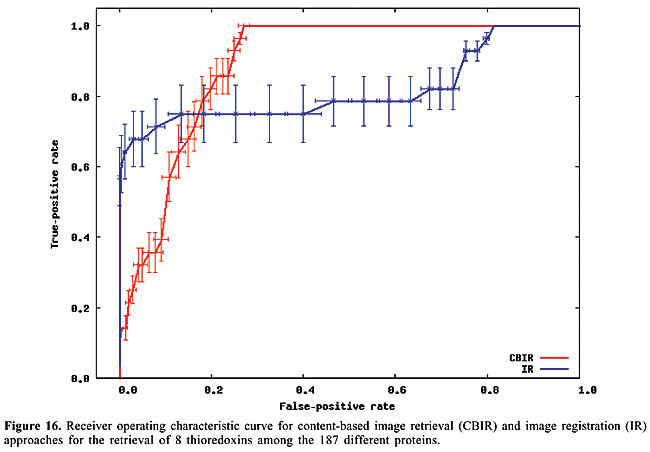
Thus, to compute the dissimilarity index between a query map, and another which we call base map, for each contact in the query map, the closest contact (of the same type) to the corresponding position in the base map is searched, and the distance between these two positions is calculated. The distances are accumulated for all the searches. Then, the maps have their roles inverted, such that the base map becomes the query map, and vice-versa. This process is repeated, and the distances obtained are accumulated with the previous values. In this way, the measure is not dependent on which one is taken as query or base map. Finally, the accumulated distance is divided by the number of searches. The dissimilarity measure is then defined as the mean distance in the searches. RESULTS AND DISCUSSION Given a database of contact map images and an algorithm, we need to use a specific image as a query to search for similar proteins. That is, when we want to search for globins in the database we have to use one specific globin as query. Thus, to verify the accuracy of the methodology and of the proposed algorithms in retrieving globins, we are expected to query the database using all the globin contact maps of the database. Evaluation of retrieval performance We selected five different protein families to test this proposed methodology. Our objective was to determine if the system is able to retrieve similar protein structures using each of the proteins of each family as queries. For that, we used the well-known statistical concepts of the confusion matrix and receiver operating characteristic (ROC) curves. A confusion matrix (Provost and Kohavi, 1998) contains information about actual and predicted classifications done by a classifier and makes it possible to evaluate the performance of classification systems. This matrix gives the true-negative, true-positive, false-negative, and false-positive rates. ROC curves are another way to examine the performance of classifiers (Swets, 1988). An ROC graph is a plot with the false-positive rate on the X-axis and the true-positive rate on the Y-axis. The false-positive rate is the number of negative instances predicted as positives divided by the number of negative instances. The true-positive rate is the number of positive instances predicted as positives divided by the number of positive instances. In the ROC space, the point (0,1) is the perfect classifier: it classifies all positive cases and negative cases correctly. It is (0,1) because the false-positive rate is 0 (none), and the true-positive rate is 1 (all). The point (0,0) represents a classifier that predicts all cases to be negative, while the point (1,1) corresponds to a classifier that predicts every case to be positive. Point (1,0) is the classifier that is incorrect for all classifications. In many cases, a classifier has a parameter that can be adjusted to increase true-positives at the cost of increasing false-positives or decreasing false-positives at the cost of decreasing true-positives. Each parameter setting provides a (false-positive, true-positive) pair and a series of such pairs can be used to plot an ROC curve. In our algorithms, the parameter used is a threshold that we use to decide if a protein is or is not of a given family. An ROC curve is independent of class distribution or error costs, and it encapsulates all information contained in the confusion matrix, since false-negatives is the complement of true-positives and true-negatives is the complement of false-positives (Swets, 1988). These curves provide a visual tool for examining the tradeoff between the ability of a classifier to correctly identify positive cases and the number of negative cases that are incorrectly classified. Another interesting feature of these curves is that the area beneath them can be used as measure of accuracy in many applications (Swets, 1988). Another way of comparing ROC points is by using a formula that equates accuracy with the Euclidean distance from the perfect classifier, point (0,1) on the graph. It is necessary to evaluate the performance of our classifiers with all the proteins of the families as queries. By doing that, we obtained 13 curves for apolipoproteins, 224 for globins, 15 for plastocyanins, 18 for RBPs, and 8 for thioredoxins. Each curve was a result of retrieving the proteins of a specific family (among the above) from the database of 187 proteins from PDB Select. We produced average curves with the standard errors for each protein family (Figures 12-16).
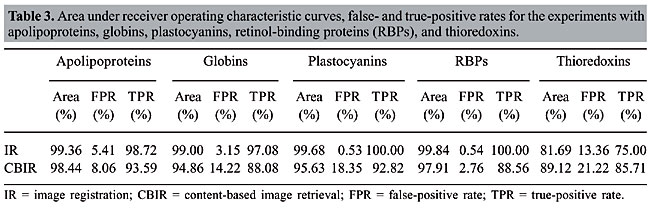
The values of the areas beneath each average curve and the false-positive rate and true-positive rate for the better cases, that is, the points of the curves that present the smaller Euclidean distances to point (0, 1) were calculated (Table 3). These rates are the ones obtained with the threshold that presented the best trade-off between the false-positive and true-positive rates.
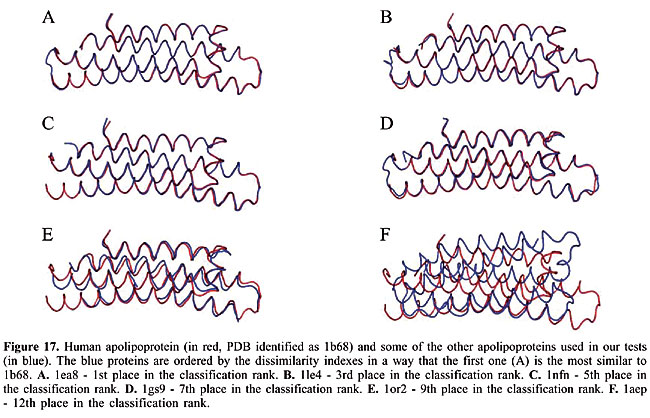
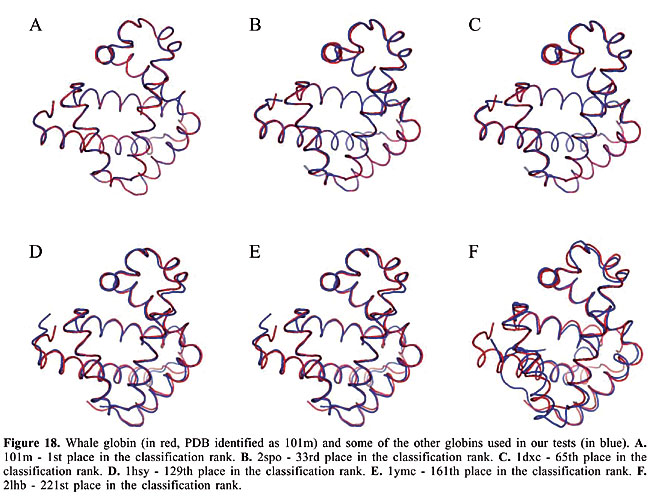
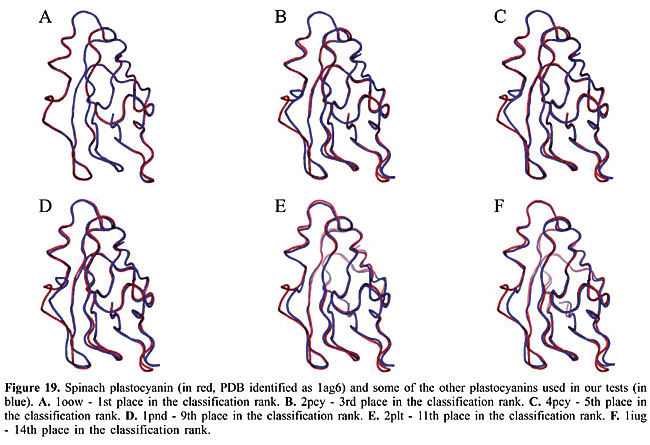
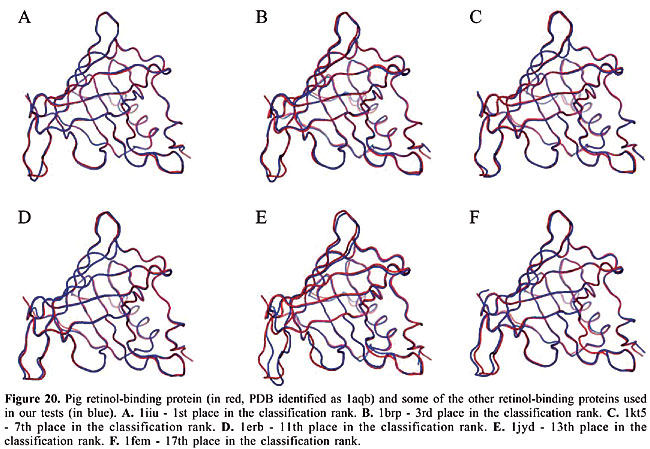
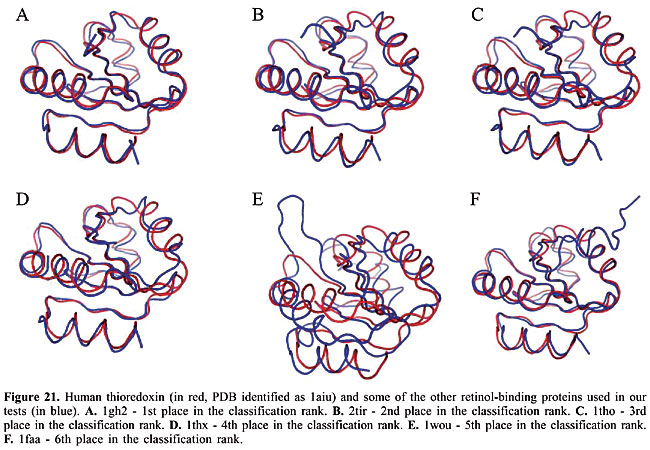
We can see that it is possible to analyze the structural similarity between proteins and also to classify them using only the information about chemical interactions between their residues (Table 3). We used five protein families of quite different topologies mixed with all the monomers of PDB Select, which is a representative subset of the PDB, and we were always able to identify the families with an average precision above 80%. The IR approach gave slightly better results than CBIR for almost all the protein families. The rightness probabilities (areas beneath the curves) were about 0.63% higher on average, and the standard errors were also smaller. The protein families that gave the best results in classification also had the smallest structural deviations. This was the case for plastocyanins and RBPs. The thioredoxins gave the worse results, and we can see that there are important structural deviations in these proteins. These deviations can add, move or delete some of the inter-residue contacts. Some examples of alignments are presented in Figures 17-21.
Evaluation of the dissimilarity measure through structural alignments To analyze the reliability of the dissimilarity indexes of our proposed algorithms, we compared them to the deviations in the three-dimensional structures of the proteins. In Figures 17-21, we can see the structural alignments of the proteins used as queries (shown in red) and some of the other proteins of the same family (in blue). Through these images, we can see that the proteins that were best classified are really much closer to the query than the others structurally. Thus, we believe that the dissimilarity indexes of the developed algorithms are appropriate to describe the similarity of protein structures, even when they are very similar. CONCLUSIONS AND FUTURE RESEARCH We developed a methodology to analyze protein structure similarity. We used image-matching techniques to retrieve the contact map images of proteins with similar chemical interaction patterns, given an image database and a contact map image as the query. We implemented the Color Correlogram proposed by Huang et al., 1997 and proposed an algorithm-based IR to evaluate our methodology. Based on experimental analyses, this methodology is appropriate for the similarity analysis of a contact map image database. As each protein structure has a unique and specific pattern of contact, the algorithms can distinguish between contact maps with different protein structures. We analyzed the accuracy of this system and found that it produced good results with apolipoproteins, globins, plastocyanins, RBPs, and thioredoxins as queries. We also identified the minimum set of interactions that exists in each protein family and its role in folding. We now intend to analyze other types of chemical interactions in the image database, such as cysteine bridges, aromatic stacking, and disulfide bonds. We believe that including more information in the images will improve the precision of the classification. We also intend to evaluate the importance of each type of interaction in the analysis. ACKNOWLEDGMENTS The authors are grateful to Brazilian CNPq and CAPES agencies for the support of this study. REFERENCES Berman HM, Westbrook J, Feng Z, Gilliland G et al. (2000). The protein data bank. Nucleic Acids Res. 28: 235-242. Branden C and Tooze J (1999). Introduction to protein structure. Garland Publishing, Inc., New York, USA. Brown LG (1992). A survey of image registration techniques. ACM Comput. Surv. 24: 325-376. Carr B, Hart WE, Krasnogor N, Burke EK et al. (2002). Alignment of protein structures with a memetic evolutionary algorithm. Proceedings of the Genetic and Evolutionary Computation Conference, Morgan Kaufman, San Francisco, CA, USA. Chew LP and Kedem K (2002). Finding the consensus shape for a protein family. Proceedings of the 18th ACM Symposium on Computational Geometry, Barcelona, Spain, June 5-7, pp. 64-73. Del Bimbo A (1999). Visual information retrieval. Morgan Kaufmann, San Francisco, CA, USA. Gan HH, Perlow RA, Roy S, Ko J et al. (2002). Analysis of protein sequence/structure similarity relationships. Biophys. J. 83: 2781-2791. Hobohm U and Sander C (1994). Enlarged representative set of protein structures. Protein Sci. 3: 522-524. Hobohm U, Scharf M, Schneider R and Sander C (1992). Selection of a representative set of structures from the Brookhaven Protein Data bank. Protein Sci. 1: 409-417. Huang J, Kumar SR, Mitra M, Zhu WJ et al. (1997). Image indexing using color correlograms. Computer Vision and Pattern Recognition (CVPR 97), San Juan, Puerto Rico, June 17-19, pp. 762-768. Kutulakos KN (2000). Approximate n-view stereo. Proceedings of the European Conference on Computer Vision, Dublin, Ireland, June 26-July 1, pp. 67-83. Lancia G, Carr R, Walenz B and Istrail S (2001). 101 optimal PDB structure alignments: a branch-and-cut algorithm for the maximum contact map overlap problem. Proceedings of the Annual Conference on Research in Computational Molecular Biology, Montreal, Canada, April 22-25, pp. 193-202. Maintz JBA and Viergever MA (1998). A survey of medical image registration. Med. Image Anal. 2: 1-36. Martin ACR (2000). The ups and downs of protein topology; rapid comparison of protein structure. Protein Eng. Des. Sel. 13: 829-837. Mojsilovic A, Gomes J and Rogowitz B (2004). Semantic-friendly indexing and quering of images based on the extraction of the objective semantic cues. Int. J. Comput. Vision 56: 79-107. Murzin AG, Brenner SE, Hubbard T and Chothia C (1995). SCOP: a structural classification of proteins database for the investigation of sequences and structures. J. Mol. Biol. 247: 536-540. Neshich G, Togawa RC, Mancini AL, Kuser PR et al. (2003). STING millennium: A web-based suite of programs for comprehensive and simultaneous analysis of protein structure and sequence. Nucleic Acids Res. 31: 3386-3392. Orengo CA and Taylor WR (1996). SSAP: sequential structure alignment program for protein structure comparison. Methods Enzymol. 266: 617-635. Orengo CA, Michie AD, Jones S, Jones DT et al. (1997). CATH - a hierarchic classification of protein domain structures. Structure 5: 1093-1108. Pentland A, Picard R and Sclaroff S (1994). Photobook: content-based manipulation of image databases. Proceedings of the SPIE, Vol. 2185, Storage and Retrieval for Image and Video Databases, San Jose, CA, USA, February 6-10, pp. 34-37. Provost F and Kohavi R (1998). On applied research in machine learning. Mach. Learn. 30: 127-132. Swets JA (1988). Measuring the accuracy of diagnostic systems. Science 240: 1285-1293. Westhead DR, Hatton C, Gilbert DR and Thornton JM (1998). A www site devoted to protein structural topology. Trends Biochem. Sci. 23: 35-36. |
|