![]()
![]()
![]()
![]()
![]()
![]()
![]()
![]()
![]()
![]()
![]()
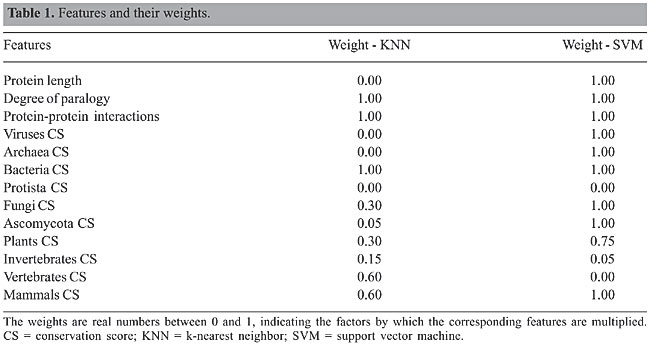
ABSTRACT. Analysis of gene deletions is a fundamental approach for investigating gene function. We evaluated an algorithm that uses classification techniques to predict the phenotypic effects of gene deletions in yeast. We used a modified simulated annealing algorithm for feature selection and weighting. The selected features with high weights were phylogenetic conservation scores for bacteria, fungi (excluding Ascomycota), Ascomycota (excluding Saccharomyces cerevisiae), plants, and mammals, degree of paralogy, and number of protein-protein interactions. Classification was performed by weighted k-nearest neighbor and with support vector machine algorithms. To demonstrate how this approach might complement existing experimental procedures, we applied our algorithm to predict essential genes and genes causing morphological alterations in yeast. Key words: Classification, Essential genes, Simulated annealing, Yeast, Phenotype INTRODUCTION Baker’s yeast, Saccharomyces cerevisiae, has been used in baking and brewing since ancient times. This organism was the first completely sequenced eukaryote, and it is one of the most intensively studied model organisms to date. Despite its importance, we know little about the phenotypic effects of most genes, and about one third of its 6,600 genes have no functional annotation at all. Analysis through gene deletion is a fundamental approach to understanding gene function by investigating the consequences of gene loss. We can define the functional significance of a gene by its essentiality; an essential gene makes the cell nonviable when knocked out. The goal of the Saccharomyces Genome Deletion Project (http://www-sequence.stanford.edu/group/yeast_deletion_project) is to collect a complete set of yeast deletion strains, using a PCR-based gene deletion strategy (Baudin et al., 1993; Wach et al., 1994). The objective of this effort is to investigate gene function through phenotypic analysis of deletion mutants and to identify genes essential for viability in yeast. Essential yeast genes, in particular those encoding proteins without human homologs, are valuable targets for antifungal drugs. To date, about 95% of the yeast genes have been tested for essentiality: 18.7% of them are essential for growth on glucose-rich media. An initial screening of 4,401 yeast genes determined that about 15% of the tested genes cause morphological alterations when they are knocked out. Several similar projects targeting other organisms are under way (Akerley et al., 2002; Kobayashi et al., 2003; Smalley et al., 2003; Salama et al., 2004). Our goal was to complement the existing experimental methods with an in silico prediction of the phenotypic effects of gene deletion. It is known that essential yeast genes share distinctive features; for example, they are more likely to have homologs in other organisms, and they have fewer paralogs than non-essential genes (Giaever et al., 2002). We hypothesize that such features could be useful for the systematic prediction of essential genes and genes causing morphological alterations. To test this hypothesis, we analyzed the dataset provided by the Saccharomyces Genome Deletion Project for relevant features. We identified phylogenetic conservation scores for bacteria, fungi (excluding Ascomycota), Ascomycota (excluding S. cerevisiae), plants, and mammals, the degree of paralogy, and the number of protein-protein interactions as the most important features. We developed an automatic classification scheme, using an ensemble of weighted k-nearest neighbor (KNN) and support vector machines for identifying essential yeast genes and for predicting morphological alterations. We applied our algorithm to the thus far untested yeast genes, yielding more than 2,000 new annotations. A similar study focusing on protein dispensability instead of morphological alterations has been reported in Chen and Xu (2005). In that study, protein dispensability in yeast was represented as a fitness score that was measured by the growth rate of gene deletion mutants. Neural network and support vector machine were applied to predict protein dispensability through high-throughput data. They found that a protein’s dispensability shows significant correlations with its evolutionary rate, duplication rate, and connectivity in protein-protein interaction and gene-expression correlation networks. MATERIAL AND METHODS Dataset description We downloaded the Yeast Deletion Collection of the Saccharomyces Genome Deletion Project (http://www-sequence.stanford.edu/group/yeast_deletion_project). The dataset we used consisted of 1,098 essential open reading frames (ORFs), 5,198 non-essential ORFs, and 360 ORFs not available in the Yeast Deletion Collection. In addition, we downloaded an accompanying collection of 4,401 deletion mutants screened for altered cell morphologies from the supplementary material of Giaever et al. (2002). The deletion mutant morphologies were grouped into seven classes: ‘elongated’, ‘round’, ‘small’, ‘large’, ‘pointed’, ‘clumped’, and ‘other’ (mutants with more than three kinds of morphological phenotypes). Inspired by related work on gene classification (Lopez-Bigas and Ouzounis, 2004), we compiled a set of features that were assumed to have predictive power. The selected features were protein length, degree of paralogy, number of protein-protein interactions, and phylogenetic conservation scores formed by comparing yeast proteins with proteins of the following groups: viruses, Archaea, bacteria, Protista, fungi (excluding Ascomycota), Ascomycota (excluding S. cerevisiae), plants, invertebrates, vertebrates (excluding mammals), and mammals. Yeast protein sequences and sequence features were obtained from the Ensembl (Hubbard et al., 2005) database. All other protein sequences were downloaded from CoGenT (Janssen et al., 2003) and SwissProt-Trembl (Gasteiger et al., 2003). We derived protein-protein interaction data from DIP (Xenarios et al., 2001). The sequence comparisons for the degree of paralogy and phylogenetic conservation scores were done using Blastp, with the BLOSUM62 matrix and an e-value threshold of 10-6. To measure paralogy of a yeast gene, we divided the score of the best Blastp hit found in yeast (excluding the hit against itself) by the Blastp score of the hit against itself. To determine phylogenetic conservation, we computed for each yeast protein in each taxonomic group a conservation score between 0 and 1. We divided the Blastp score of the closest homologue in that taxonomic group by the Blastp score of the protein against itself. Based on the chosen taxonomic partition, this measure gives an estimation of the mutation rate that the protein has been subjected to during evolution, and it is independent of the length of the protein (see Lopez-Bigas and Ouzounis, 2004). All features were scaled to a range between 0 and 1. Classification algorithms We used two different classification algorithms: weighted KNN (Cover and Hart, 1967) and support vector machine (Vapnik, 1999). We then combined the two classifiers by merging their predictions (essential genes). KNN is an instance-based learning algorithm that locates the k closest neighbors of each test object in the training dataset using a weighted Euclidean distance measure. The test object is then assigned the class to which most of its neighbors belong. We chose the weighted KNN algorithm as a classifier for our problem because it is well suited for multi-modal classes. So, even if the target class consists of objects whose independent variables have different characteristics for different subsets, it can still lead to high accuracy. We tested the performance of the KNN classifier with multiple values of k and selected k = 21. Support vector machine (SVM) is a relatively new learning algorithm that solves two-class pattern recognition problems. It maps the training data in a high-dimensional space and searches for the best decision hyperplane that separates the two classes with the maximum margin. A new object is classified by plotting it in the same high-dimensional space and by determining its position with respect to the separating hyperplane. Feature selection with weight adjustment Adjusting the relative weights of the features is an optimization step that improves the classification power of the feature set. Simulated annealing is a global optimization algorithm (Kirkpatrick et al., 1983), which we used to adjust the weights of the features. We used a wrapper approach (Kohavi et al., 1997), in which the classification algorithm is used in the decision making process. We used classification accuracy as our objective. We started feature selection with a greedy backward elimination and then switched to simulated annealing for weight adjustment. At each iteration of simulated annealing, a feature is selected for weight adjustment. The special characteristic of this algorithm is that while better solutions are always accepted, poorer solutions are also accepted with a non-zero probability. This prevents the algorithm from getting stuck in a local optimum. We blended some techniques of Tabu search (Glover and Laguna, 1993) with our algorithm in order to improve its run time behavior. Our algorithm stores recently visited attributes in a Tabu list. The attributes in the Tabu list cannot be selected for weight adjustment during the Tabu tenure. The Tabu tenure that we used was half the number of attributes of our gene set. The direction for weight adjustment, either positive or negative, was chosen based on the expected gain in classification accuracy. We then kept adjusting the weight in small increments, using hill climbing, until we saw no further improvement in the objective function. RESULTS We constructed a balanced dataset with an equal number of essential and non-essential genes in order to achieve a better generalization, as there are fewer essential genes than non-essential genes. We used all 1,098 essential genes and 1,098 randomly selected non-essential genes to form a training set of 2,196 genes. We used k-fold cross-validation to evaluate the performance of our classifiers. The data set is divided into k balanced subsets of approximately equal size, and training and testing of the algorithm is repeated k times. Each time, one of the k subsets is used as test set and the other k-1 subsets are merged to form the training set. The average performance across all k trials is then computed. In case of high variability in the results, this average is likely to be unreliable. Averaging multiple cross-validation results using different splits in the dataset might reduce this variance and yield a better performance estimation (Kohavi, 1995). The features and the final weight combination returned by weight adjustment procedures are shown in Table 1. The weights are real numbers between 0 and 1, which indicate the factor by which the corresponding feature is weighted. The wrapper approach returned two different sets of weights for the two classifiers.
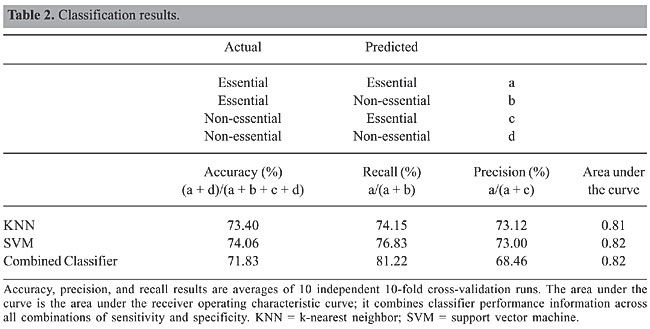
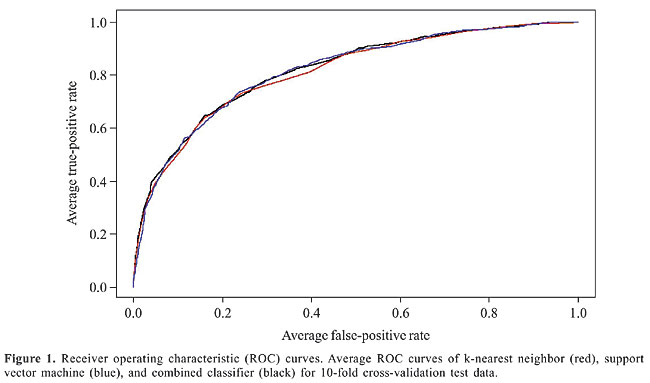
Table 2 shows our classification results. The values shown are the averages of 10 different 10-fold cross-validation experiments. SVM performed marginally better in accuracy and recall than KNN, while the precision values of KNN were higher than those of SVM. Our combined classifier achieved a very high recall value (81.22%), while it still maintained an acceptable accuracy value. We can increase precision at the expense of recall, and vice versa, by varying the thresholds for the predictions. Receiver operating characteristic (ROC) curves can be used to display classifier performance with different combinations of specificity (= true-positive rate) and sensitivity (= 1-false-positive rate). The x-axis of an ROC curve shows the fraction of false-positives and the y-axis the fraction of true-positives in the classifier results. Figure 1 shows the ROC curves for the different classifiers using the average true-positive and false-positive rates obtained from a 10-fold cross-validation experiment. The area under the ROC curve describes the accuracy of the prediction; the greater the area, the better the prediction algorithm (Table 2).
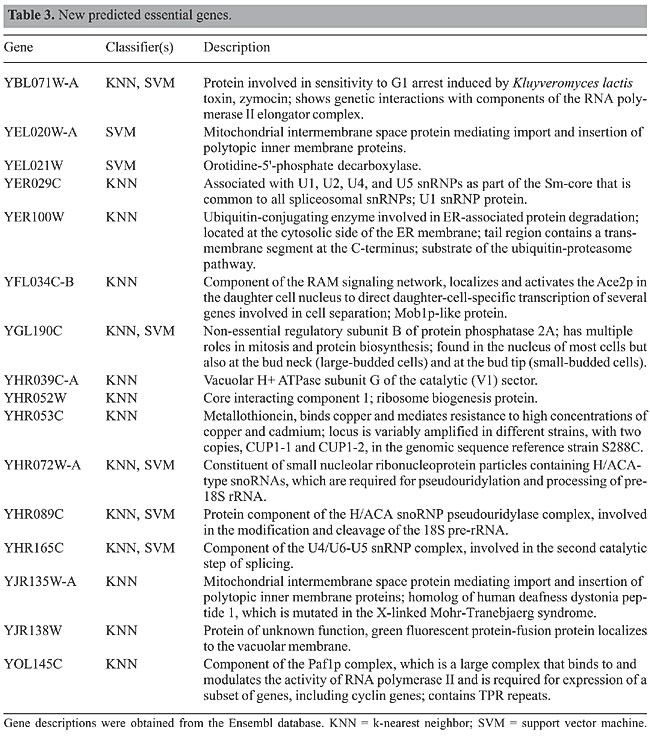
There were 360 genes in our gene set for which the PCR-based gene deletion strategy did not work. We attempted to classify these genes using our procedure. KNN predicted 14 of these genes as essential and 346 as non-essential, while SVM predicted 7 genes as essential and the remaining 353 genes as non-essential. Five genes, YBL071W-A, YGL190C, YHR072W-A, YHR089C, and YHR165C, were predicted as essential by both classifiers. Table 3 lists the genes that were predicted as essential from within the set of unknown genes, along with the classifier that made the prediction, and a brief description, obtained from Ensembl.
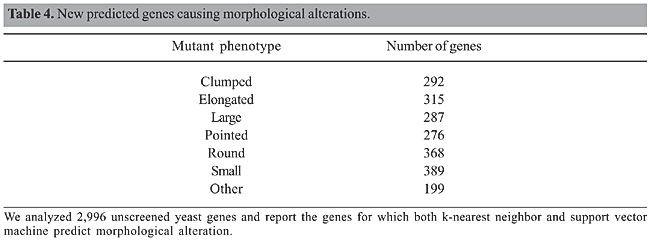
In addition, we also investigated genes causing morphological alterations. Giaever et al. (2002) visually screened 4,401 of the yeast deletion mutants to identify genes involved in specifying cell shape and size. We used this data set as training data for our predictions. A summary of the results is shown in Table 4.
DISCUSSION We developed a method to predict essential genes and morphological alterations caused by gene deletions in yeast. We started with a feature set consisting of protein length, degree of paralogy, number of protein-protein interactions, and phylogenetic conservation in various taxonomical groups. Our approach uses a “staggered” simulated annealing algorithm to determine a distinctive feature set and corresponding feature weights. Two enhancements were added to simulated annealing in order to speed up and stabilize the search process. First, we used the concept of a Tabu list to ensure that the search space is sampled more evenly. Second, we implemented local hill climbing to guide the algorithm to possibly interesting states. The learned feature set emphasizes the importance of paralogs, protein-protein interactions, and gene conservation for the prediction of essential genes and morphological alterations. Although these results are in good concordance with related gene classification projects (Kuramochi and Karypis, 2001; Lopez-Bigas and Ouzounis, 2004; Chen and Xu, 2005), they have to be interpreted very carefully. Additional features might render some of the current features less important. Even more troublesome is the possibility that bias in the underlying data sources might corrupt predictions. For example, a recent study (Coulomb et al., 2005) suggests that many postulated relationships between topological characteristics in yeast interaction networks and gene essentiality are artifacts due to such database bias, and that dispensability of a gene is only weakly related to its number of protein-protein interactions. Our approach tries to safeguard against bias in single features by combining multiple features and classifiers into a consensus prediction, but systematic research to identify bias in databases and experimental techniques, as well as to develop robust algorithms, is critical for any subsequent research. Our single classifiers (KNN and SVM) achieve values between 73-77% for accuracy, precision, and recall, and our combined classifier achieves a high recall value of 81%. It is very likely that additional gene features, such as mRNA or protein expression levels (Mering et al., 2002), codon adaptation index (Coghlan and Wolfe, 2000), propensity of gene loss (Krylov et al., 2003), or less biased data sources, such as pools of large-scale protein interaction studies instead of a dataset of mixed sources like DIP, as suggested in Coulomb et al. (2005), would even further improve these results. We plan to conduct corresponding experiments in the future. We used our method to supplement the collection of essential yeast genes and to complement screening for genes involved in morphological alterations. We predicted 16 new essential genes and over 2,000 new candidates for morphological alterations. These are candidates for further biological investigations. Although our method requires training data and may require further experimental verification, there are many potential applications, in which our technique might complement and speed up other approaches. For example, there are more than 900 E. coli genes of unknown status with respect to essentiality (Hashimoto et al., 2005). REFERENCES Akerley BJ, Rubin EJ, Novick VL, Amaya K, et al. (2002). A genome-scale analysis for identification of genes required for growth or survival of Haemophilus influenzae. Proc. Natl. Acad. Sci. USA 99: 966-971. Baudin A, Ozier-Kalogeropoulos O, Denouel A, Lacroute F, et al. (1993). A simple and efficient method for direct gene deletion in Saccharomyces cerevisiae. Nucleic Acids Res. 21: 3329-3330. Chen Y and Xu D (2005). Understanding protein dispensability through machine-learning analysis of high-throughput data. Bioinformatics 21: 575-581. Coghlan A and Wolfe KH (2000). Relationship of codon bias to mRNA concentration and protein length in Saccharomyces cerevisiae. Yeast 16: 1131-1145. Coulomb S, Bauer M, Bernard D and Marsolier-Kergoat MC (2005). Gene essentiality and the topology of protein interaction networks. Proc. Biol. Sci. 272: 1721-1725. Cover TM and Hart PE (1967). Nearest neighbor pattern classification. IEEE Trans. Inf. Theory 13: 21-27. Gasteiger E, Gattiker A, Hoogland C, Ivanyi I, et al. (2003). ExPASy: The proteomics server for in depth protein knowledge and analysis. Nucleic Acids Res. 31: 3784-3788. Giaever G, Chu AM, Ni L, Connelly C, et al. (2002). Functional profiling of the Saccharomyces cerevisiae genome. Nature 418: 387-391. Glover F and Laguna M (1993). In: Modern heuristic techniques for combinatorial problems (Reeves C, ed.). Blackwell, Oxford, UK, pp. 70-141. Hashimoto M, Ichimura T, Mizoguchi H, Tanaka K, et al. (2005). Cell size and nucleoid organization of engineered Escherichia coli cells with a reduced genome. Mol. Microbiol. 55: 137-149. Hubbard T, Andrews D, Caccamo M, Cameron G, et al. (2005). Ensembl 2005. Nucleic Acids Res. 33: D447-D453. Janssen P, Enright AJ, Audit B, Cases I, et al. (2003). COmplete GENome Tracking (COGENT): a flexible data environment for computational genomics. Bioinformatics 19: 1451-1452. Kirkpatrick S, Gelatt CD and Vecchi MP (1983). Optimization by simulated annealing. Science 4598: 671-680. Kobayashi K, Ehrlich SD, Albertini A, Amati G, et al. (2003). Essential Bacillus subtilis genes. Proc. Natl. Acad. Sci. USA 100: 4678-4683. Kohavi R (1995). A study of cross-validation and bootstrap for accuracy estimation and model selection. International Joint Conference on Artificial Intelligence, Palais de Congres, Montreal, Quebec. Kohavi R, John G and Pfleger K (1997). The wrapper approach. Artif. Intell. J. 97: 273-324. Krylov DM, Wolf YI, Rogozin IB and Koonin EV (2003). Gene loss, protein sequence divergence, gene dispensability, expression level, and interactivity are correlated in eukaryotic evolution. Genome Res. 13: 2229-2235. Kuramochi M and Karypis G (2001). Gene classification using expression profiles: A feasibility study. 2nd IEEE International Symposium on Bioinformatics and Bioengineering-BIBE, Bethesda, MD, USA, pp. 191-200. Lopez-Bigas N and Ouzounis CA (2004). Genome-wide identification of genes likely to be involved in human genetic disease. Nucleic Acids Res. 32: 3108-3114. Salama NR, Shepherd B and Falkow S (2004). Global transposon mutagenesis and essential gene analysis of Helicobacter pylori. J. Bacteriol. 186: 7926-7935. Smalley DJ, Whiteley M and Conway T (2003). In search of the minimal Escherichia coli genome. Trends Microbiol. 11: 6-8. Vapnik V (1999). The nature of statistical learning theory. Springer-Verlag New York Inc., New York, NY, USA. von Mering C, Krause R, Snel B, Cornell M, et al. (2002). Comparative assessment of large-scale data sets of protein-protein interactions. Nature 417: 399-403. Wach A, Brachat A, Pohlmann R and Philippsen P (1994). New heterologous modules for classical or PCR-based gene disruptions in Saccharomyces cerevisiae. Yeast 10: 1793-1808. Xenarios I and Eisenberg D (2001). Protein interaction databases. Curr. Opin. Biotechnol. 12: 334-339. |
|