![]()
![]()
![]()
![]()
![]()
![]()
![]()
![]()
![]()
![]()
![]()
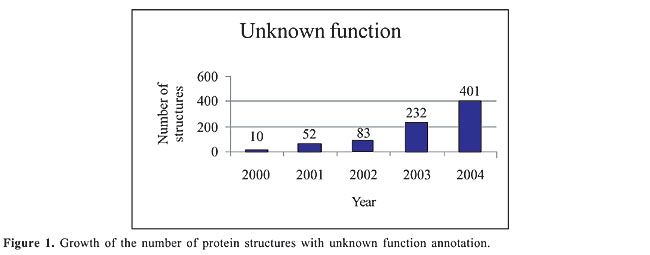
ABSTRACT. Predicting enzyme class from protein structure parameters is a challenging problem in protein analysis. We developed a method to predict enzyme class that combines the strengths of statistical and data-mining methods. This method has a strong mathematical foundation and is simple to implement, achieving an accuracy of 45%. A comparison with the methods found in the literature designed to predict enzyme class showed that our method outperforms the existing methods. Key words: Protein function prediction, Protein structure, Naive Bayes, Enzyme classification number, Bayesian classifier, Data classification INTRODUCTION The debate about the relationship between protein structure and function, and how to infer the latter from the former, has gained momentum (Shrager, 2003). Most methods to classify a query protein rely on detecting sequence or structural similarity with a functionally annotated protein. Unfortunately, this is not always possible because the number of new proteins without a sequence or structural homolog grows every year. For instance, in the Protein Data Bank - PDB (http://www.pdb.org) (Berman et al., 2000), the number of protein structures with “Unknown Function” annotation is increasing very fast. According to the PDB Metrics software (http://sms.cbi.cnptia.embrapa.br/SMS/pdb_metrics), the number of structures with unknown function is rapidly growing with each newly sequenced genome (Figure 1).
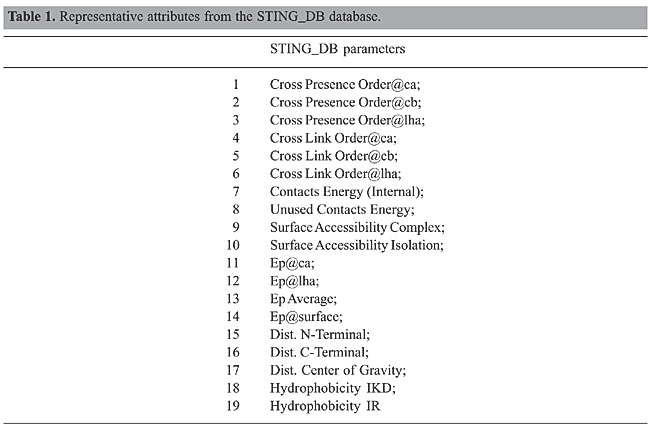
It is a paradox that despite the fact that we have plenty of structural information about proteins, we often know little about their function. It should be possible to infer or predict function based on structural parameters, if structure and function are related in some sense. Recently, Dobson and Doig (2005) proposed a new approach to predict enzyme class from protein structure that sheds some light on the relationship between structure and function. The idea behind their method is to compute structural attributes and assign a protein structure to one of six different protein classes. In this approach, six protein enzyme classes and their respective members are selected according to enzyme classification (EC) number, from the ASTRAL SCOP 1.63 (http://astral.berkeley.edu) (Brenner et al., 2000; Chandonia et al., 2002). Subsequently, for each structure, a matrix is created, where the rows are assigned to one of the 20 amino acids and the columns correspond to structural attributes. The authors argue that the attributes selected to describe each protein are deliberately simple and fast to calculate. The accuracy of their method is achieved by combining the prediction of one-class versus one-class support vector machine models. In doing so, a subset of parameters is optimized and the model is capable of making overall assignments of EC number to an accuracy of 35% with the top-ranked prediction. Encouraged by this promising approach, we decided to search structural parameters available in the STING_DB database that could confirm and possibly improve their results. STING_DB is a database behind the Diamond STING package (http://www.cbi.cnptia.embrapa.br/SMS) (Neshich et al., 2003, 2004b, 2005). There are more than 300 physical-chemical parameters calculated from the protein structure. Many of them are highly correlated and need to be carefully selected to avoid the insertion of undesirable noise in the model. One of the novelties with our approach is that our parameter selection procedure combines the strengths of statistical and data-mining methods to improve the prediction accuracy. Another significant difference between our approach and that one proposed by Dobson and Doig (2005) is that we constructed, for each structure, one matrix in which the rows were assigned to structural parameters and the columns to residues. The reason for this choice is the source of the data: Java Protein Dossier - JPD (http://www.cbi.cnptia.embrapa.br/SMS/JPD) (Neshich et al., 2004a). JPD is one module of Diamond STING. It is an interactive presentation of important physical-chemical characteristics of the macromolecular structure described in a PDB file. With a few mouse clicks, the user can access data about chosen parameters, call other Diamond STING modules, refine the search for a specific characteristic, or, what is more important for our experiments, export all data to a CSV-format file, i.e., a flat file separated by commas. Preprocessing the CSV files is necessary, because the number of residues is not identical for every protein in the set, which means that the matrices have different dimensions. By interpreting the rows as a one-dimensional signal, we perform a convenient mathematical transformation and truncate the expansion coefficients to a given threshold. The choice of the number of coefficients to keep was a trade off between the model’s simplicity and its performance. The model’s simplicity was inversely proportional to the number of coefficients retained; on the other hand, the model’s performance was directly proportional to them. The experiments showed that 40 coefficients yielded the best results. Finally, using the Naive Bayesian classifier, the model was built. We attained, on average, an overall assignment of EC number to an accuracy of 45%, which outperforms the results obtained by Dobson and Doig (2005). MATERIAL AND METHODS Data set Although the ASTRAL SCOP release available at the time was already 1.69, we decided to keep the same set of protein structures used by Dobson and Doig to compare the methods. In doing so, we put both methods under the same conditions. Otherwise, it would be difficult to assess the real contribution of our method, because the improved outcomes could be simply a response to a better data set. Parameter selection Choosing which attributes to keep and which to discard is not a trivial problem in enzyme prediction. The full set of attributes used to describe each protein may not be optimal. In general, certain attributes are noisy and compromise the accuracy of enzyme prediction. The challenge here is to remove the noisy attributes from the database describing the proteins, without losing the usefulness of the data. Several methods have been proposed for parameter selection, ranging from different feature selection methods to multidimensional scaling. The feature selection methods are often performed according to the nature of the data, and therefore they are not generally applicable to all kinds of data analyses (Langley, 1994; Blum and Langley, 1997). The multidimensional scaling methods, on the other hand, have been used in several diverse fields (e.g., social sciences, market research, and physics) to analyze subjective evaluations of pairwise similarities of entities (Young, 1987). Another alternative for parameter selection is to look for methods that rely on identifying potentially discriminating attributes by using some statistical measures of the information content of attributes, such as their correlation coefficients. The intuition behind these methods is that two well-correlated attributes contain much the same information, and therefore one of them could be eliminated from the analysis. In doing so, we would reduce some noise in the data, which would improve the prediction accuracy. Our approach to improve prediction accuracy consists of three major steps. We refer to these steps as attribute pairwise correlation, redundancy identification and noise removal, and we describe them as follows: Attribute pairwise correlation In this step, we compute the correlation matrix between the protein parameters subject to prediction, for each PDB file. The most significant parameters can be seen in Table 1. The correlation matrix will identify pairs of parameters that are well correlated. In particular, we set our threshold (correlation coefficient) to 0.8, i.e., attribute pairs with a correlation coefficient equal to or greater than 0.8 contain one candidate to be removed from the data since the presence of both is not necessary. We could also slide this threshold to take values either higher or lower than 0.8.
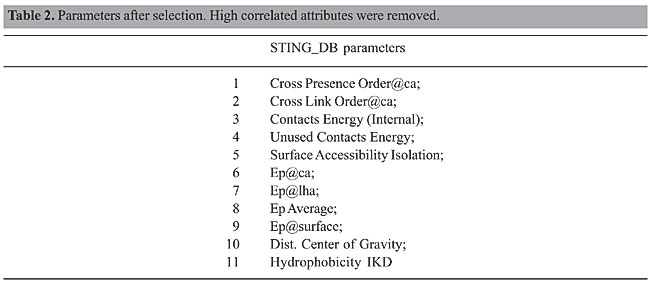
Redundancy identification After identifying pairs of attributes that are well correlated in each PDB file, we tried to identify whether these attributes were also well correlated in the entire database. To accomplish this, we used a data-mining task called association (Han and Kamber, 2001). The goal of this data-mining task is to find interesting associations and/or correlation relationships among items in a large set of data. In our approach, the idea is to identify groups of frequent attribute pairs that are well correlated in the entire database. A pair of attributes is said to be frequent if it appears in at least a given percentage s (called support) of all PDB files. In our experiments, we set the support threshold (s) to 60%, which is very high for data-mining applications. Redundancy removal Once the redundancy was identified in the previous step, we removed some redundant attributes from the data (Table 2). The removal process took into account the attribute pairs whose frequencies in the database met the support threshold (s = 60%). For each pair of attributes that were well correlated in the database, we randomly removed one attribute for the purpose of reducing the noise in the data. In the end, the remaining attributes were subject to prediction. However, we applied another transformation of the data before the prediction phase to put all the attributes under the same condition.
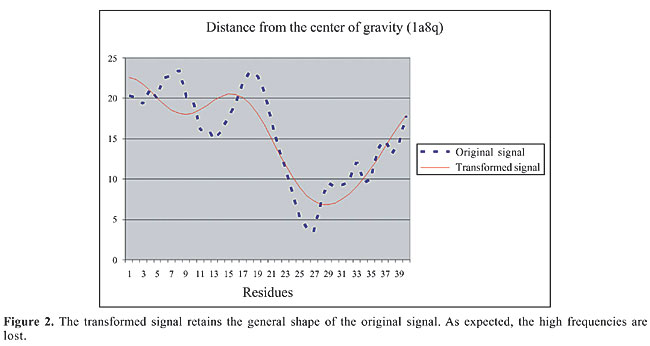
Preprocessing the data After the parameter selection phase, every protein structure was represented by a rectangular matrix (number of parameters versus number of residues). The problem with this representation is that the number of residues varies from protein to protein, which results in matrices with different dimensions. To build the method, all the matrices should have the same number of rows and columns. To accomplish that, every matrix row was seen as a signal, and we borrowed an idea from the Signal Processing field to better represent it. After some experimentation, we decided to perform the discrete cosine transform - DCT (Ahmed et al., 1974) in every row (signal), and truncate the number of expansion coefficients to 40. The DCT was chosen for two main reasons: 1) it is an orthonormal transformation that preserves the norms and angles of the vectors; and 2) it is a real transformation, instead of a complex transformation like discrete Fourier transform. We found that 40 DCT coefficients are enough to get a good representation of the representative signal (parameter) and maintain the general shape of the original signal (Figure 2).
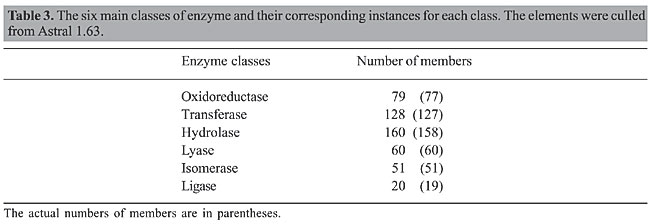
Building the model Predictive modeling The goal of predictive modeling is to predict some attributes in a database based on other attributes. The target attribute is called class, i.e., the dependent variable in statistics terminology. If the attribute being predicted is a numeric variable (e.g., number of contacts), the prediction becomes a regression problem. In contrast, if the class label attribute is categorical, the task at hand is called classification. In both cases, a set of data is taken as input, and a model (a pattern or a set of patterns) is generated. This model can be used to predict values of the class for new data. For instance, given a data set, only a part of it is typically used to generate a predictive model. This part is referred to as the training data set. The individual tuples making up the training data set are referred to as training samples and are randomly selected from the sample population. Since the class label of each training sample is provided, this step is known as supervised learning. The remaining part, which is called the testing set, is reserved for evaluating the predictive performance of the learned model. The testing set is used to estimate the performance of the model on new (unseen data), i.e., to estimate the validity of the patterns on new data. Classification and regression have numerous applications, including credit approval, bioinformatics, medical diagnosis, and selective marketing, among others. Bayesian classification Bayesian classifiers are statistical classifiers that can predict class membership probabilities, such as the probability that a given sample belongs to a particular class. Bayesian classification is based on the Bayes’ theorem (Feller, 1971). Bayes’ theorem is a result in probability theory, which gives the conditional probability distribution of a random variable A, given: 1) information about another variable B in terms of the conditional probability distribution of B given A, and 2) the marginal probability distribution of A alone. In particular, Naive Bayesian classifiers assume that the effect of an attribute value on a given class is independent of the values of the other attributes. This assumption is called class conditional independence. It is made to simplify the computations involved and, in this sense, is considered “naive.” In practice, dependencies can exist between variables; however, when the assumption holds true, then the Naive Bayesian classifier is the most accurate in comparison with other classifiers (Han and Kamber, 2001). We adopted the Naive Bayesian classifier to predict enzyme class from protein structure. The adoption of this classifier was influenced by the following: 1) it is one of the most effective and efficient classification algorithms in the literature (Zhang and Su, 2004); 2) it is simple to implement and use; 3) it gives a better test set accuracy than any other known method, including backpropagation and C4.5 decision trees (Elkan, 1997), and most importantly, 4) it exploits the most from our method for parameter selection, which relies on removing noise from well-correlated variables that are dependent. We used the implementation of the Naive Bayesian classifier available at Weka, version 3.4.4 (http://www.cs.waikato.ac.nz/ml/weka) (Witten and Frank, 2005). Weka is a software environment for knowledge analysis composed of a collection of machine learning algorithms for data-mining tasks. Weka contains tools for data preprocessing, classification, regression, clustering, association rules, and visualization. It is an open-source software issued under the GNU General Public License. RESULTS We considered the ASTRAL SCOP data set, release 1.63 in our experiments. The number of members per class is shown in Table 3. There were 492 protein structures in six different classes.
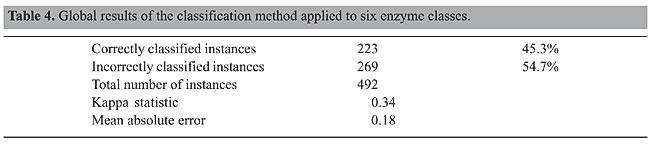
The original number of protein structures was 498. However, six protein structures (1hlr, 1uox, 1gms, 1htq, 1bir, 1mu7) were not found in STING_DB, and therefore they were excluded from our data set. The classes had different numbers of members. For example, the Hydrolase class had 158 members, while Ligase had only 19. To build the Bayesian model, it is necessary to balance the class element numbers; otherwise, the outcomes could be biased toward the classes with more members. One strategy to deal with this problem is to produce a random subsample of the data set using sampling with replacement (Breiman, 1996). We applied two restrictions: preserve the total number of elements and generate a uniformly distributed subsample. In doing so, the number of elements in the classes is balanced. It has been demonstrated (Goutte, 1997) that, for a small data set, cross-validation is markedly superior to the split-sample technique to validate models. In k-fold cross-validation, the data are divided into k subsets of approximately equal size. The model is then trained k times, each time leaving out one of the subsets from training, but using only the omitted subset to validate the model. We used a 10-fold cross-validation test. The global results are summarized in Table 4. We found that 45.3% of 492 instances were correctly classified, which is a good accuracy.
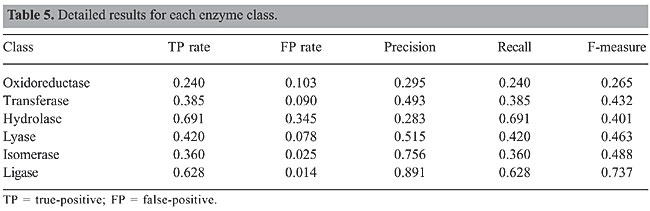
The detailed results by class are shown in Table 5. The first column refers to the six classes that were considered in the predictions. True-positives are the number of instances correctly classified in a given class divided by the number of instances in that class, while the false-positive rate is equal to 1 minus the recall of the test, where recall corresponds to the number of true-positives divided by the sum of true-positives and false-negatives. Precision is the proportion of true-positives in a given class divided by the total number of instances classified in that class. F-measure is a harmonic measure that gets the most of both precision and recall, and it is defined as: F-measure = 2* precision* recall/(precision + recall).
DISCUSSION We proposed a method for predicting EC, which combines the strengths of statistical and data-mining methods. We showed that our method has a strong mathematical foundation and is simple to implement. Our method achieved an accuracy of 45.3% and outperformed the existing methods available in the literature designed to predict enzyme class. Our research builds on the work of Dobson and Doig (2005) to predict protein function based on structural parameters without using alignment-based methods. The Dobson and Doig’s method uses a one versus one support vector machine to assign enzyme class to the top ranked among all the 15 prediction sub-problems. In other words, their approach compares the six protein classes, two at a time, and considers the top rank among them. This is quite different from what we have proposed. Our method is all versus all Bayesian classifier, which makes the problem much more difficult to handle. For instance, in our approach the expected probability of a protein being classified correctly is only 16.7%. Therefore, to reach an accuracy of 45.3%, we purposely used the foundation of predictive modeling to improve the prediction of enzyme class from protein structure parameters. We did not use the simplest parameters to be computed for our model. Rather, we considered the most representative parameters available at STING_DB. One class may outperform the other in terms of accuracy, such as Ligase (Table 5). The main reason is that, in general, the attributes do not discriminate all the classes equally. The main contributions of the present study can be summarized as follows: · A method to remove noisy attributes from the database describing the proteins, without losing the usefulness of the data; · Mapping of attributes into a frequency space to remove high frequencies and represent all the PDB files in terms of matrices with the same number of rows and columns; · We investigated the resampling with replacement technique to improve the classification accuracy. In doing so, we achieved an accuracy of 45.3%, which surpasses the results obtained by the previous method proposed in the literature. Currently, we are investigating other classification methods to improve the accuracy of protein prediction, which warrants further exploration. In particular, we are comparing the Naive Bayesian classifier against classification methods based on decision trees and multilayer neural network. ACKNOWLEDGMENTS We are grateful to Dr. Ronaldo Dias from the Statistics Department of the State University of Campinas for his valuable comments on our methods. Research supported by CNPq/Brazil, under grant No. 401695/2003-4. REFERENCES Ahmed A, Natarajan T and Rao KR (1974). Discrete cosine transform. IEEE Trans. Biomed. Eng. C23: 90-93. Berman HM, Westbrook J, Feng Z, Gilliland G, et al. (2000). The protein data bank. Nucleic Acids Res. 28: 235-242. Blum A and Langley P (1997). Selection of relevant features and examples in machine learning. Artif. Intell. 97: 245-271. Breiman L (1996). Bagging predictors. Machine Learning 24: 123-140. Brenner SE, Koehl P and Levitt M (2000). The ASTRAL compendium for protein structure and sequence analysis. Nucleic Acids Res. 28: 254-256. Chandonia JM, Walker NS, Lo CL, Koehl P, et al. (2002). ASTRAL compedium enhancements. Nucleic Acids Res. 30: 260-263. Dobson PD and Doig AJ (2005). Predicting enzyme class from protein structure without alignments. J. Mol. Biol. 345: 187-199. Elkan C (1997). Boosting and Naive Bayesian Learning. Technical Report No. CS97-557, Department of Computer Science and Engineering University of California, San Diego, CA, USA. Feller W (1971). An introduction to probability theory and its applications. John Wiley and Sons, Inc., New York, NY, USA. Goutte C (1997). Note on free lunches and cross-validation. Neural Comput. 9: 1246-1249. Han J and Kamber M (2001). Data mining: concepts and techniques. Morgan Kaufmann Publishers, San Francisco, CA, USA. Higa RH, Togawa RC, Montagner AJ, Palandrani JC, et al. (2004b). STING Millennium Suite: integrated software for extensive analyses of 3D structures of proteins and their complexes. BMC Bioinformatics 5: 107. Langley P (1994). Selection of relevant features in machine learning. Proceedings of the AAAI Fall Symposium on Relevance, AAAI Press, New Orleans, LA, USA. Neshich G, Togawa RC, Mancini AL, Kuser PR, et al. (2003). STING Millennium: A web-based suite of programs for comprehensive and simultaneous analysis of protein structure and sequence. Nucleic Acids Res. 31: 3386-3392. Neshich G, Rocchia W, Mancini AL, Yamagishi ME, et al. (2004). JavaProtein Dossier: a novel web-based data visualization tool for comprehensive analysis of protein structure. Nucleic Acids Res. 32: W595-W601. Neshich G, Borro LC, Higa RH, Kuser PR, et al. (2005). The Diamond STING server. Nucleic Acids Res. 33: W29-W35. Shrager J (2003). The fiction of function. Bioinformatics 19: 1934-1936. Witten IH (2005). Data mining: Practical machine learning tools and techniques. Morgan Kaufmann Publishers, San Francisco, CA, USA. Young FW (1987). Multidimensional scaling. Lawrence Erlbaum Associates, Hillsdale, NJ, USA. Zhang H and Su J (2004). Naive Bayesian classifiers for ranking. Proceedings of the 15th European Conference on Machine Learning (ECML2004), Pisa, Italy. |
|