![]()
![]()
![]()
![]()
![]()
![]()
![]()
![]()
![]()
![]()
![]()
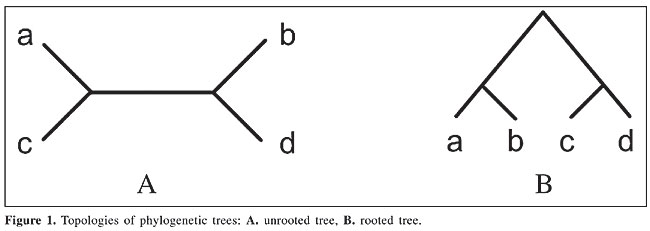
ABSTRACT. We developed a new approach for the reconstruction of phylogenetic trees using ant colony optimization metaheuristics. A tree is constructed using a fully connected graph and the problem is approached similarly to the well-known traveling salesman problem. This methodology was used to develop an algorithm for constructing a phylogenetic tree using a pheromone matrix. Two data sets were tested with the algorithm: complete mitochondrial genomes from mammals and DNA sequences of the p53 gene from several eutherians. This new methodology was found to be superior to other well-known softwares, at least for this data set. These results are very promising and suggest more efforts for further developments. Key words: Phylogeny, Bioinformatics, Evolutionary computation, Ant colony optimization INTRODUCTION Phylogenetic trees are developed in order to help unveil the evolutionary relationships among species, taking into account the Darwinian principle of the natural evolution of species. That is, by analyzing a set of amino acid sequences (or proteins) of different species, it can be determined how these species probably have been derived during their evolution. Reconstruction of phylogenetic trees is an important problem in Bioinformatics, and, like many others, it is still an open subject for research. This is mainly due to the high degree of complexity of the problem (Gonnet, 1994) that leads to intractable search spaces when dealing with the phylogeny of a large number of species. A phylogenetic tree can be considered a binary tree, whose leaf nodes represent the species to be analyzed and inner nodes the ancestral species from which the current species have evolved. Also, phylogenetic trees may or may not have a root (see Figure 1) that indicates the oldest ancestor. Usually, a rooted tree better represents the phylogenetic history of species. On the other hand, an unrooted tree gives a better correlation between species.
Considering n species, it is possible to construct NT different trees. Equation 1, presented by Felsenstein (1973), shows how NT can be computed for both rooted and unrooted trees. For instance, if we would like to find the best tree using the method of maximum similarity for (only) 15 species, we should try 213,458,046,676,875 trees.
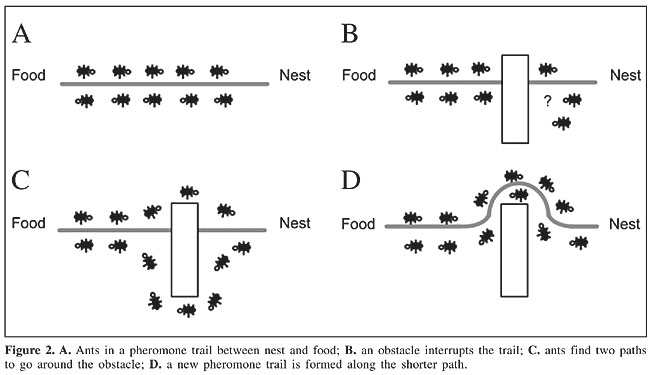
Current methods for the reconstruction of phylogenetic trees can be roughly grouped into two families: feature-based methods and distance-based methods. Feature-based methods, such as maximum parsimony and maximum likelihood (Felsenstein, 1973), use previously aligned sequences of nucleotides as input, and they are less susceptible to errors. On the other hand, distance-based methods, such as UPGMA (unweighted pair group method using arithmetic averages, Sokal and Michener, 1958) and neighbor-joining (Saitou and Nei, 1987), use a matrix representing the distances between pairs of species, and they are based on the principle of similarity. Ant colony optimization Social insects that live in colonies, such as ants, termites, wasps, and bees, develop specific tasks according to their role in the colony. One of the main tasks is the search for food. Real ants, when searching for food, can find such resources without visual feedback (they are practically blind), and they can adapt to changes in the environment, optimizing the path between the nest and the food source. This fact is the result of stigmergy, which involves positive feedback, given by the continuous deposit of a chemical substance, known as pheromone. A classic example of the construction of a pheromone trail in the search for a shorter path is shown in Figure 2 and was first presented by Colorni et al. (1991). In Figure 2A there is a path between food and nest established by the ants. In Figure 2B an obstacle is inserted in the path. Soon, ants spread to both sides of the obstacle, since there is no clear trail to follow (Figure 2C). As the ants go around the obstacle and find the previous pheromone trail again, a new pheromone trail will be formed around the obstacle. This trail will be stronger in the shortest path than in the longest path, as shown in Figure 2D.
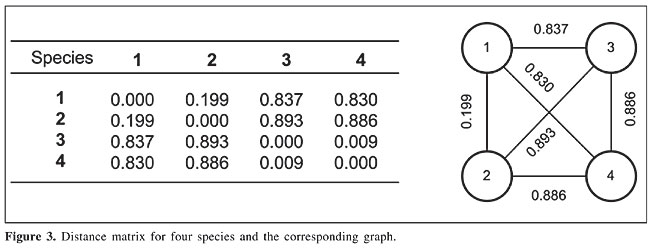
As shown in Parpinelli et al., 2002, there are many differences between real ants and artificial ants, mainly: artificial ants have memory, they are completely blind and time is discrete. On the other hand, an ant colony system allows simulation of the behavior of real-world ant colonies, such as: artificial ants have preference for trails with larger amounts of pheromone, shorter paths have a stronger increment in pheromone, and there is an indirect communication system between ants, the pheromone trail, to find the best path. Related work Korostensky and Gonnet (2000) presented an alternative method, named circular sum, for obtaining the sequence of branches that will give the smallest tree. This method models the problem as a circular traveling salesman problem (cTSP), so that for a complete tour, the distance from the last city to the first one is added to the tour distance. The tour corresponds to the sequence of species, and the tour distance is the smallest score for this sequence. To construct the tree, a simple idea is used: the correct tree will have the same score that is found by means of the cTSP. In this way, a second algorithm is developed, constructing trees and comparing their scores with the one found by cTSP. This search method is somewhat similar to the maximum parsimony method, and thus requires a large computational effort for constructing a phylogenetic tree for a large number of species. Kumnorkaew et al. (2004) presented a new strategy for constructing trees. In this algorithm, a preprocessing step defines a number of intermediary nodes, by means of the intersection of the input species, which are the ancestral species. From this point on, input species are considered source nodes and the intermediary nodes are compulsory passing points. This strategy is similar to the well-known Steiner problem. Kumnorkaew et al. (2004) reported that equivalent trees were obtained to those constructed using the neighbor-joining method. However, considerable preprocessing is necessary to define proper intermediary points, which are underused. ANT COLONY OPTIMIZATION-BASED MODEL To define how ant colony optimization (ACO) is applied to the reconstruction of phylogenetic trees, we used a fully connected graph, constructed using the distance matrix among species (Figure 3). In this graph, nodes represent the species and edges represent the evolutionary distances between species.
Initially, ants start in a randomly selected node. Then, they travel across the structured graph, and at each node a transition function (Equation 2) determines its direction. This equation represents the probability that the k-th ant, being at node i, goes to node j in its next step;
where Pk(i,j) is the probability of transition between node i and j, t is the pheromone trail between two nodes, d(i,j) is the evolutionary distance between nodes i and j, Jik is the set of nodes connected to node i and already visited by the k-th ant, and a and b are arbitrary constants. Equation 2 is composed of two terms: the first is based on the evolutionary distance between species i and j, and the second is based on the accumulated experience - the pheromone trail. This trail is represented as a matrix (like that for the distance between species), whose values are dynamically changed by the algorithm, and determined according to the paths chosen by ants. Therefore, t (i,j) represents the attractiveness of node j, while the ant is at node i. Therefore, the objective of a given ant is to find a path in the graph that maximizes the transition probabilities, thus obtaining a sequence of species that produces the smallest evolutionary distance. Differently from a traditional ACO, where moves are made between nodes, our system creates an intermediary node between the two previously selected ones. This node will represent the ancestral species of the other two, and it will not be in the list of nodes (species) to be set in the tree. Using such an intermediary node, distances to the remaining nodes (species) are recomputed by means of Equation 3, as follows:
where u is a node that does not belong to the set of nodes connected to node i and already visited by the k-th ant, dnu(i,j) is the distance between the new node n and node u, based on the previous distances between (i,u) and (u,j), d(i,u) is the distance between nodes i and u, and h is a scale constant that defines the distance between the new node n and its descendents i and j. This procedure is repeated until all nodes belong to the list of already visited nodes, and then a path is constructed. The score of this path is given by the sum of the transition probabilities of the adjacent nodes of the path. Paths constructed by the ants are used for updating the pheromone trail. An increment of the pheromone trail is made at all nodes belonging to at least one path, created in an execution cycle. This key point avoids fast convergence to a local maximum. The pheromone trail matrix is updated according to Equation 4:
where r is the rate of evaporation of the pheromone, which reduces the persistence of the environment to the ants. In this system, the rate of increment of pheromone, Dt(i,j), was modified to allow an increment proportional to all the obtained paths, given by the division of the current path and the best path, as shown in Equation 5:
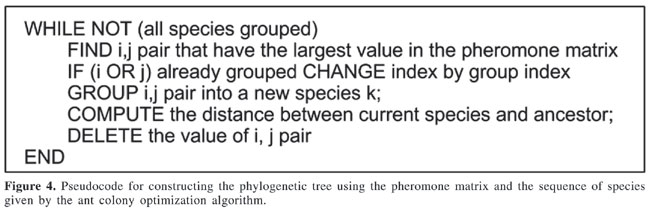
where k is the number of ants, c(t) is the path constructed by an ant up to time t, Sc(t) is the score of path c(t), and Sbest is the score of the best path found up to now. Using this procedure, ants travel through the graph, and at the end of a predefined number of cycles, it is possible to reconstruct the tree using the best path found. Construction of the phylogenetic tree The execution of the ACO algorithm, as detailed above, gives a linear sequence of species and a measure of closeness between them, using the pheromone matrix. Using these elements, the phylogenetic tree can be constructed, as shown by the algorithm of Figure 4.
COMPUTATIONAL EXPERIMENTS AND RESULTS To evaluate the methodology that we have proposed, we used two data sets. The first is a set of complete mitochondrial genomes (mtDNA) from 20 species of mammals, previously used in other studies (see, for instance, Cao et al., 1998). The second data set was especially constructed for this work and is based on DNA sequences of gene p53 from eight eutherian species. The data for this latter data set were found in the NCBI site (http://www.ncbi.nih.gov). Results of the construction of phylogenetic trees were compared with the well-known PHYLIP package using the programs NEIGHBOR and FITCH (Fitch and Margoliash, 1967). The comparison of two trees is based on the analysis of their structure and the total distance between nodes (Equation 6), proposed by Kumnorkaev et al. (2004):
where dobs is distance obtained by the algorithm, and dexp is the expected distance from the distance matrix, between two species, and n is the number of species. This distance measure is somewhat similar to the computation of the quadratic error. Two trees obtained with the mtDNA data set are shown in Figure 5. They were obtained using the proposed ACO and the neighbor-joining method, respectively. Although species were similarly grouped, there are small differences in the order of groupings. This is what causes the differences in the distances between branches.
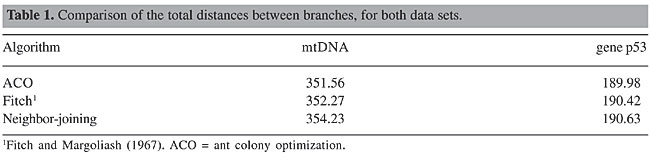
Regarding the distance between branches, the proposed ACO obtained better values when compared with Fitch and neighbor-joining methods, for both data sets (Table 1).
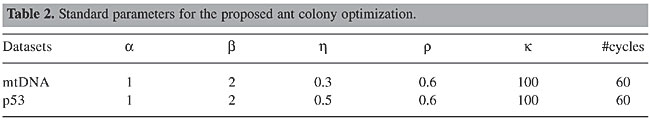
Sensitivity of parameters Several experiments were done with different parameters, and, for both data sets, the best results were found using the parameters shown in Table 2.
Parameter a controls the exploration of the search space, by weighting the importance of the pheromone trail in the decision of an ant when it arrives at a branch. The algorithm is sensitive to high values of this parameter, leading to a fast convergence to a local optimum. Parameter b defines the relative importance of the distance between species in the transitions between nodes. In practice, we observed that it has to be higher than a. But values that are too high make the algorithm converge to a tree that groups species sequentially. The pheromone trail evaporation is controlled by the parameter r, which is influenced by the number of ants (k) and the number of cycles. Experimentally, we observed that values higher than 0.8 do not allow convergence to the same tree, and values lower than 0.2 make the algorithm find trees with larger distances between branches. It is supposed that this is a consequence of the convergence to a local optimum at the beginning of the run. Regarding the number of ants (k), we found two distinct behaviors. When k is too low (say, k < 50), or too high (say, k > 400), a random behavior is observed in the resulting trees for repeated runs. For intermediary, but high values of k (say, 200 < k < 350), a well-defined tree can be obtained, but with distances greater than those obtained by other approaches. The range within which the best trees were obtained was 90 < k < 120, although we believe that this value may depend on other parameters. Future work will address this issue. The evolutionary distance between an ancestor and two descendent species is controlled by parameter h. For the p53 data set, we observed that the best tree was obtained using h = 0.5, meaning that the distance between the ancestor and the two descendents is the same for both branches. For the mtDNA data set, this parameter was set to 0.3, meaning that the distance between descendents and the ancestral species will be divided into 30% for the first descendent and 70% for the other. CONCLUSIONS We presented a new method for the reconstruction of phylogenetic trees using the ACO paradigm. For the particular data sets used, the preliminary results show that this method gives better results than other established algorithms. However, it cannot be claimed that this will remain so for any other data set. Although it was observed that the algorithm is sensitive to parameter changes, no serious attempt was made to optimize parameters. Therefore, it is fair to expect even better performances if an optimized set of parameters can be found. Overall, the results are very promising and encourage further developments. Future work will include exhaustive tests to find a more optimized set of parameters and analysis of its behavior for different types of data sets. Also, we intend to develop an improved methodology to deal with aligned and non-aligned sequences. More data sets will be tested in the future so as to evaluate how the algorithm behaves as the size of sequence and/or the data set increases. ACKNOWLEDGMENTS The authors thank CNPq for financial support (grant numbers: 350053/03-0, 475049/03-9 and 402018/03-6). REFERENCES Cao, Y., Janke, A., Waddell, P.J., Westerman, M., Takenaka, O., Murata, S., Okada, N., Pääbo, S. and Hasegawa, M. (1998). Conflict among individual mitochondrial proteins in resolving the phylogeny of eutherian orders. J. Mol. Evol. 47: 307-322. Colorni, A., Dorigo, M. and Maniezzo, V. (1991). Distributed optimization by ant colonies. In: Proceedings of European Conf. on Artificial Life. Elsevier, Amsterdam, pp. 134-142. Felsenstein, J. (1973). Maximum likelihood estimation of evolutionary trees from continuous characters. Am. J. Hum. Gen. 25: 471-492. Fitch, W. and Margoliash, E. (1967). The construction of phylogenetic trees. Science 155: 279-284. Gonnet, G.H. (1994). New algorithms for the computation of evolutionary phylogenetic trees. In: Computational Methods in Genome Research (Suhai, S., ed.). Plenum, New York, pp. 153-161. Korostensky, C. and Gonnet, G.H. (2000). Using traveling salesman problem algorithms for evolutionary tree construction. Bioinformatics 16: 619-627. Kumnorkaew, M., Ku, K. and Ruenglertpanyakul, P. (2004). Application of ant colony optimization to evolutionary tree construction. In: Proceedings of 15th Annual Meeting of the Thai Society for Biotechnology. Chiang Mai, Thailand. Parpinelli, R.S., Lopes, H.S. and Freitas, A.A. (2002). Data mining with an ant colony optimization algorithm. IEEE Trans. Evol. Comput. 6: 321-332. Saitou, N. and Nei, M. (1987). The neighbor-joining method: a new method for reconstructing phylogenetic trees. Mol. Biol. Evol. 4: 406-425. Sokal, R.R. and Michener, C.D. (1958). A statistical method for evaluating systematic relationships. Univ. Kans. Sci. Bull. 28: 1409-1438. |
|