![]()
![]()
![]()
![]()
![]()
![]()
![]()
![]()
![]()
![]()
![]()
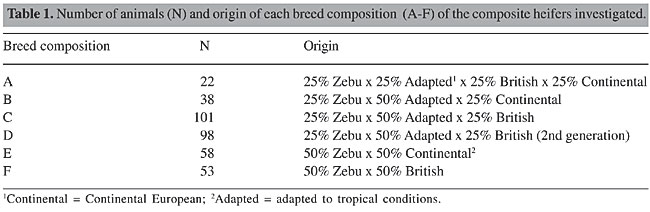
ABSTRACT. A population of 370 European-Zebu composite beef heifers, consisting of six different breed compositions (A-F), were characterized genetically, using RFLP markers of luteinizing hormone receptor (LHR) and follicle-stimulating hormone receptor (FSHR) genes. Our objectives were to genetically characterize this population and to determine the structure and the genetic variability of this hybrid herd. The genotypes were determined through PCR, followed by digestion with restriction endonucleases. The PCR-RFLP analysis made it possible to identify the LHR and FSHR genotypes, as well as to characterize the degree of heterozygosis, which was high for all of the breed compositions, for both loci, except for two combinations for LHR (B and C). The observed heterozygosity (Ho) was lower than the expected heterozygosity (He) for compositions C (for LHR) and A and D (for FSHR); however, for the population as a whole, Ho was above He (with a mean of 57 versus 46%, respectively), reflecting the elevated genetic variability in this population and also the informative value of the RFLP markers, which could be useful for population genetic characterization studies. The analysis of the degree of genetic structure of this population, estimated by the Nei’s statistic, for both loci, indicated an elevated total genetic diversity (HT = 47%), with most of this variability being due to intrapopulational diversity (HS = 46%), with a low degree of genetic differentiation among the six breed compositions (GST = 1.2%). The estimates generated by the Wright’s F statistic indicated a non-endogamic population, with excess heterozygotes (FIT = -0.22), which was also observed at the intrapopulational level (FIS = -0.23). The results gave evidence that the genetic selection applied to this European-Zebu composite population did not affect the expected high genetic variability for this type of crossbreeding, which makes it possible to use these animals to obtain economically valuable productive and reproductive traits. Key words: Composite beef cattle, RFLP, Genetic characterization, DNA INTRODUCTION The production of beef cattle by crossbreeding with different aptitudes has become increasingly common in Brazil. The objective of this approach has been to combine the best traits, optimizing the heterosis effects and the complementary traits of the breeds. Following this line of reasoning, the crossbreeding between animals of Zebu origin (Nelore) and those of European origin, also including animals adapted to tropical conditions (such as Senepol and Caracu), results in a composite bovine with various breed compositions, depending on the percentage contribution of each of the composite breed. This strategy supplies very valuable material for taking advantage of heterozygosis and genetic variability at specific loci or loci linked to quantitative traits of economic importance. Molecular markers, such as microsatellites and restriction fragment length polymorphisms (RFLPs), have a high degree of polymorphism and have been widely used to investigate the genetic properties of populations and to identify genes that code for important traits (Tambasco et al., 2000; Almeida et al., 2000; Machado et al., 2003). Several aspects can be useful for the characterization of a particular breed or population, including phenotypic, physiological and reproductive traits, origin, habitat, geographic distribution, and genetic parameters (Vasconcellos et al., 2003). The characterization of the genetic structure of populations, breeds and species provides information necessary for developing breeding program strategies, as it allows genetic variability studies, information that is also important for genetic conservation programs; these characterizations provide means to support and intensify the traditional selection methods. Our objectives were to genetically characterize a population of European-Zebu composite beef heifers with various breed compositions, in order to gain knowledge about the structure and genetic variability of this hybrid herd, using two RFLP molecular markers for the luteinizing hormone receptor (LHR) and follicle-stimulating hormone receptor (FSHR) genes. MATERIAL AND METHODS Animals Blood samples for DNA extraction were obtained from 370 composite beef heifers, from two Brazilian regions; the animals had six different breed compositions (A-F; Table 1), based on the percentage contribution of cattle breeds of Zebu origin, those adapted to tropical conditions, or British European or Continental European breeds.
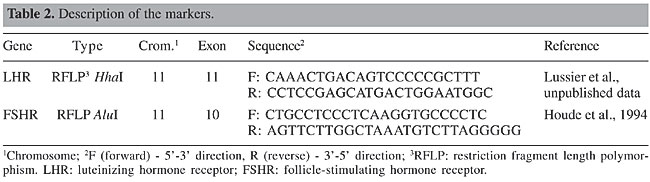
Markers Based on the polymorphism results obtained with single-strand conformational polymorphism for LHR (Milazzotto, 2001) and FSHR (Campagnari, 2002) genes, two fragments were selected (Table 2), which were analyzed with PCR-RFLP. The genotypes were later identified through 1.5% agarose gel electrophoresis and by the absence or presence of restriction sites, recognized by the restriction endonucleases HhaI and AluI for the LHR and FSHR genes, respectively.
Genotyping The genomic DNA was extracted and precipitated in NaCl (Olerup and Zetterquist, 1992). The amplification reactions were made in an MJ Researcher®, PTC-100 (Programmable Thermal Controller) thermocycler, using the temperature and time cycles indicated by Milazzotto (2001) for LHR and by Campagnari (2002) for FSHR. Each PCR reaction was done with about 200 ng DNA, in a final reaction volume of 25 µL, containing 10X PCR buffer (20 mM Tris-HCl, pH 8.4, 50 mM KCl), MgCl2 (3.5 mM for LHR; 2.0 mM for FSHR), 0.5 mM of each dNTP (deoxynucleotide triphosphate), 0.4 µM of each of the primers and 1 unit of Taq DNA polymerase. The products of the amplifications were then digested with restriction enzymes corresponding to each marker; the solution was incubated at 37°C for 3 h. The resulting fragments were separated by electrophoresis at 65 V in a 1.5% agarose gel, stained with ethidium bromide (5 µg/mL), in 1% Tris-borate-EDTA (TBE) buffer, analyzed with a Scanner Laser (Fujifilm Fla 3000G) with excitation at 520 nm and emission at 580 nm. A DNA standard (100-bp DNA ladder; Life Technologies) was used in each gel to allow determination of fragment size. Analysis of the results Estimates were made of the allelic and genotypic frequencies, by allele and genotypic counts of the various genotypes for each locus (Weir, 1996). The probability of Hardy-Weinberg equilibrium associated with the observed genotypic frequencies was obtained using the c2 test for each breed composition and the exact probability test, due to the occurrence of alleles with very low or nearly zero frequencies, generating the exact probability estimates (P values) (Guo and Thompson, 1992). Considering a random association of gametes as the observed heterozygosity (Ho, Hardy-Weinberg equilibrium), significant values (P < 0.05) reject Ho, and the non-significant values accept them. The mean genetic variabilities (Weir, 1996) were calculated for each locus and breed composition. The Ho was calculated by directly determining the frequency of heterozygosis:
where: N1ij is the number of heterozygous individuals at locus 1; N is the total number of individuals analyzed. The expected heterozygosity (He) was calculated based on the observed allelic frequencies:
where: p1i is the frequency of allele i at locus 1; n is the number of alleles at locus 1. In order to describe the genetic structure of the population and to quantify the genetic diversity, estimates were made of the Nei’s diversity index (Nei, 1973), based on differences between allele frequencies: total genetic diversity (HT), intrapopulational (HS) and interpopulational diversity (GST), calculated as:
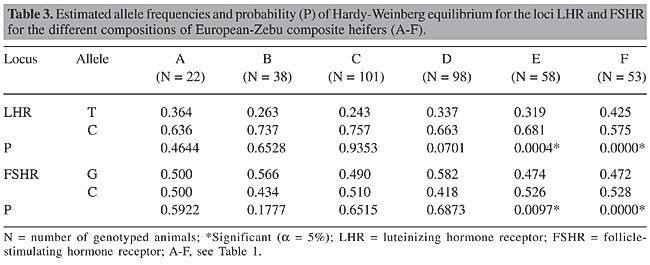
The estimates of heterozygosity and of genetic diversity made it possible to calculate Wright’s F statistic (Wright, 1950), indicated for subdivided populations (Zucchi, M.I., personal communication), including the coefficients or fixation rates FIT (total endogamy or deviation from total population panmixia), FIS or f (intrapopulational endogamy or deviation from panmixia with the subpopulation) and FST (interpopulational endogamy or due subdivision). The statistic programs GENEPOP (web version, Raymond and Rousset, 1995) and TFPGA - Tools for Population Genetic Analysis (Miller, 1997) were used in the estimation of these parameters. RESULTS AND DISCUSSION Genotypic and allelic frequencies and Hardy-Weinberg equilibrium The PCR-RFLP analysis allowed us to identify three genotypes of each gene. Genotypes TT, CT and CC were found for LHR/HhaI and genotypes GG, CG and CC for FSHR/AluI. The observed genotypic frequencies for the LHR gene varied from 0 to 0.091 (with a mean of 5%), 0.366 to 0.849 (mean of 54%) and 0.151 to 0.574 (mean of 42%), respectively, for genotypes TT, CT and CC, in the six different breed types, giving the highest frequency of heterozygosis in all the animals, except those with breed compositions B and C. Higher values for TT (0.540) and lower values for CC (0.030) were reported by Milazzotto (2001) for a Nelore population. The observed genotypic frequencies for the FSHR gene varied from 0.075 to 0.347 (with a mean of 23%), 0.455 to 0.792 (mean of 58%) and 0.132 to 0.273 (mean of 19%), respectively, for genotypes GG, CG and CC, giving a greater frequency of heterozygosis for all of the breed compositions. Campagnari (2002) reported higher values for genotype GG (0.490), though she did not find the genotype CC in a Nelore population, which leads us to suggest further studies on other bovine populations. Table 3 shows a predominance of allele C compared to T in all the animals genotyped for LHR, which is opposite to what has been found for Nelore animals (0.755 for T versus 0.245 for C) reported by Milazzotto (2001). This difference in the proportion of alleles T and C in Nelore and European-Zebu animals should be checked with similar studies in other bovine populations. The allelic frequencies for FSHR were similar among the different breed compositions, while in Nelore cattle the G allele (0.745) was more frequent than the C allele (0.255) (Campagnari, 2002).
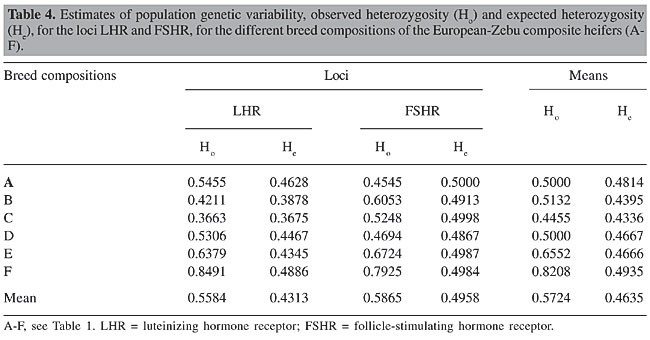
A population is considered to be in Hardy-Weinberg equilibrium when the allelic (p and q) and genotypic (p2, 2pq and q2) frequencies remain constant from one generation to the next, due to a random association of gametes. According to Tambasco et al. (2000) and Vasconcellos et al. (2003), some events, such as an accumulation of some genotypes, subdivision of the population, mutation, selection, migration, or endogamy, can result in a state of disequilibrium in the population. Both of the loci LHR and FSHR significantly deviated (P < 0.05) from Hardy-Weinberg equilibrium within the whole population, which could be due to the low frequency of T homozygotes observed for LHR (4%) and to the high proportion of heterozygotes for LHR (54%) and for FSHR too (58%). Another reason that should be emphasized is the selection pressure to which this population has been exposed to for particular traits of interest, using bulls that had been evaluated for genetic and reproductive traits in breeding programs involving artificial insemination or natural mating. On the other hand, Hardy-Weinberg equilibrium was observed for all of the breed compositions, for both loci, except compositions E and F (Table 3), probably because they were from two divergent populations (50% Zebu x 50% European) and had a high proportion of heterozygotes. Heterozygosity estimates The estimates of Ho and He are commonly calculated in order to estimate the extent of genetic variability in a population, which helps select animals that can be used as genitors in the next generations. The mean values for Ho and He for this hybrid population, considering the two loci, were 57 and 46%, respectively (Table 4).
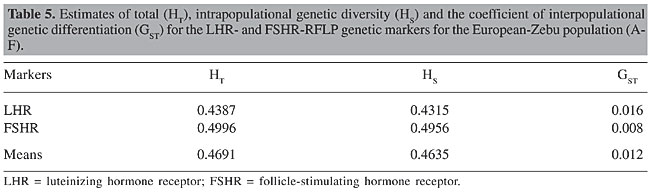
In an investigation of nine microsatellites, Machado et al. (2003) reported mean values of 35 and 53%, respectively, for Ho and He in two populations of Bos indicus and Bos taurus. On the other hand, in a hybrid population 3/8 Nelore x 5/8 Aberdeen Angus (Brangus Ibagé), Almeida et al. (2000) found a mean Ho of 54% with four microsatellites, while Duarte et al. (2005) found a high mean He of 77% for the same type of crossbreeding, using three microsatellites linked to the b chain of FSH (FSHb). When they were evaluated separately, the loci gave more than 50% mean Ho (56% for LHR and 59% for FSHR) and more than 40% mean He (43% for LHR and 50% for FSHR); consequently they can be considered informative for describing a population. This peculiarity, along with well-distributed allelic frequencies, makes this locus a good candidate for paternity tests and for segregation analyses (Machado et al., 2003). According to Moioli et al. (2004), He is a good indicator of the appropriateness of a marker for describing genetic variability of populations of domesticated animals, and its calculation takes into account the number of alleles (the more, the better), as well as differences in the allelic frequencies between breeds. Vasconcellos et al. (2003) indicated that lower values for He are expected for diallelic than for multiallelic markers, such as microsatellites, for example. They reported values of 87% He for a microsatellite marker with 12 alleles, compared to 25%, for a RFLP marker with two alleles. As Ho is a measure of variability that translates the observed heterozygosity, and He is the expected heterozygosity, larger differences between these parameters for a locus indicate genotypic disequilibrium of the sample (Tambasco et al., 2000). The largest differences between these estimates were observed for the animals with the breed compositions E and F, possibly due to the absence of genotype TT for locus LHR and to the excess of heterozygotes found for both loci. All of the breed compositions had higher values of Ho than He for LHR, except the group C animals, which had similar values. In the case of locus FSHR, only two compositions (A and D) had higher He than Ho. According to Machado et al. (2003), an Ho lower than He can be an indication of a degree of endogamy, which can result from an intensive selection process. However, when we compared the mean values for Ho and He, we did not see evidence of such a reduction in genetic variability. These results indicate a high genetic diversity in this composite bovine population, derived from various contributions of different breeds, which makes it possible to use these animals to obtain economically important traits, since knowing and maintaining the genetic variability and the frequency of superior genotypes are crucial for the selection of animals for new traits. Estimates of genetic diversity and fixation rates Table 5 shows the estimates generated by the Nei’s statistic (Nei, 1973), based on the observed differences in the allelic frequencies, in order to quantify the degree of genetic diversity, or the distribution of total genetic variation (HT), within the population (or breed composition) (HS) and between populations (GST), for the LHR- and FSHR-RFLP markers.
The mean value found for HT, for both loci was 47%, with much more of the genetic diversity being due to the intrapopulational than the interpopulational portion. The mean value of HS indicated expressive differentiation within each subpopulation or breed composition, given the elevated proportion of intrapopulational genetic diversity that was found (46%). According to Almeida et al. (2000), a high intrapopulational genetic diversity is expected when breed groups of the same species are compared. They found only 7% diversity due to interpopulational variability when comparing Brangus Ibagé with Red Angus. The interpopulational comparison showed similar allelic frequencies for the two loci, which resulted in reduced genetic differentiation and similar allelic frequencies for both genes, which led to reduced genetic differentiation between the six breed compositions, giving a mean GST of 1.2%. Considering that the LHR and FSHR genes are related to the initiation of puberty, among other equally important manifestations, a reproductive trait commonly reported to have moderate heritability (0.31 according to Laster et al., 1979; 0.47 reported by Splan et al., 1998), it makes sense that the allelic frequencies are similar for the various breed compositions, with consequent low interpopulational variability. Besides the Nei’s statistic, used to estimate the degree of genetic structuring of populations through molecular markers, we also used the Wright’s F statistic for analysis of the rates of fixation or coefficients of total endogamy (FIT) within the subpopulation (FIS or f) and between subpopulations (FST calculated in the same ways as GST), obtained from the heterozygosity and genetic diversity values. The FIT and FIS values for LHR were negative, from -0.27 to -0.29, and from -0.18 to -0.17 for FSHR, respectively, which indicates a non-endogamic population, with excess heterozygotes at the intrapopulational level. These results allow us to conclude that the genetic selection of this population has not affected its expected genetic variability for this type of crossbreeding between breeds of Bos indicus and Bos taurus with different aptitudes, which correlates with the deviation from Hardy-Weinberg equilibrium and with the heterozigosity estimates found for the population as a whole. Knowing the genetic variability and the structure of the genetic differences within and between the populations makes it easier to develop new selection strategies for animal breeding programs and to define new sources of genetic variation for future generations. CONCLUSIONS The PCR-RFLP analysis made it possible to identify the genotypes for LHR and FSHR genes, as well as to determine the degree of heterozygosis, which was found to be high in all of the European-Zebu breed compositions, for both loci. The differences in the genotypic and allelic frequencies between this composite herd and the Nelore breed stimulated the investigation of LHR- and FSHR-RFLP markers in another herds; these were considered informative and therefore useful for population genetics studies. The observed mean heterozygosity values were greater than the expected values, at both loci, showing that there was a high degree of genetic variability in these animals; most of this variability was intrapopulational, resulting in a low degree of genetic differentiation between populations, conditions that allow us to characterize the composite population as non-endogamic, with an excess production of heterozygotes. The results allowed us to conclude that this population was not affected by the continuous selection to which it is submitted, which means that these animals can be used for crossbreeding, in order to obtain economically valuable reproductive and productive traits. Knowledge about the genetic variability and the genotypic frequencies in this population would aid in the selection of the best animals, defining potential genetic sources for future generations. ACKNOWLEDGMENTS We are grateful to “Fundação de Amparo à Pesquisa do Estado de São Paulo” (FAPESP) (No. 01/00790-4) for financial support, which made possible this research. REFERENCES Almeida, S.E.M., Machado, M.S.N., Steigleder, C.S., Gama, C.L., Hutz, M.H., Henkes, L.E., Moraes, J.C.F. and Weimer, T.A. (2000). Genetic diversity in Brazilian bovine herd based on four microsatellite loci. Genet. Mol. Biol. 23: 345-350. Campagnari, F. (2002). Novas variantes moleculares dos genes dos receptores do hormônio liberador de gonadotrofinas (GnRHR) e do hormônio folículo estimulante (FSHR) em fêmeas Bos primigenius indicus (Nelore). M.Sc. thesis, Instituto de Biociências, Universidade Estadual Paulista, Campus de Botucatu, Botucatu, SP, Brazil. Duarte, L.B.H., Moraes, J.C.F. and Weimer, T.A. (2005). Diversity of microsatellites linked to the FSHb gene, their usefulness for individual identification and association with reproductive performance. Ciênc. Rural 35: 145-149. Guo, S.W. and Thompson, E.A. (1992). Performing the exact test of Hardy-Weinberg proportion for multiple alleles. Biometrics 48: 361-372. Houde, A., Lambert, A., Saumande, J., Silversides, D.W. and Lussier, J.G. (1994). Structure of the bovine follicle-stimulating hormone receptor complementary DNA and expression in bovine tissues. Mol. Reprod. Dev. 39: 127-135. Available at [URL: http://www.ncbi.nlm.nih.gov/entrez/query.fcgi?db=Nucleotide; Genbank accession number: L22319]. Laster, D.B., Smith, G.M., Cundiff, L.V. and Gregory, K.E. (1979). Characterization of biological types of cattle (cycle II). II. Postweaning growth and puberty of heifers. J. Anim. Sci. 48: 500-508. Lussier, J.G., Houde, A., Ethier, J. and Silversides, D.W. Complementary DNA structure of the bovine LH receptor. Available at [URL: http://www.ncbi.nlm.nih.gov/entrez/query.fcgi?db=Nucleotide, Genbank accession number: U20504]. Unpublished results. Machado, M.A., Schuster, I., Martinez, M.L. and Campos, A.L. (2003). Genetic diversity of four cattle breeds using microsatellite markers. Rev. Bras. de Zoot. 32: 93-98. Milazzotto, M.P. (2001). Mutações no gene do receptor do hormônio luteinizante (LHR) bovino e associação com precocidade sexual em fêmeas Bos primigenius indicus (Nelore). M.Sc. thesis, Instituto de Biociências, Universidade Estadual Paulista, Campus de Botucatu, Botucatu, SP, Brazil. Miller, M.P. (1997). Tools for population genetic analyses (TFPGA) (version 1.3): a Windows program for the analysis of allozyme and molecular population genetic data. Computer software distributed by the author. Moioli, B., Napolitano, F. and Catillo, G. (2004). Genetic diversity between Piedmontese, Maremmana, and Podolica cattle breeds. J. Hered. 95: 250-256. Nei, M. (1973). Analysis of gene diversity in subdivided populations. Proc. Natl Acad. Sci. USA 70: 3321-3323. Olerup, O. and Zetterquist, H. (1992). HLA-DR typing by PCR amplification with sequence-specific primers (PCR-SSP) in 2 hours: an alternative to serological DR typing in clinical practive including donor-recipient matching in cadaveric transplantation. Tissue Antigens 39: 225-235. Raymond, M. and Rousset, F. (1995). GENEPOP (version 1.2): population genetics software for exact tests and ecumenicism. J. Hered. 86: 248-249. Splan, R.K., Cundiff, L.V. and Van Vleck, L.D. (1998). Genetic parameters for sex-specific traits in beef cattle. J. Anim. Sci. 76: 2272-2278. Tambasco, D.D., Alencar, M.M., Coutinho, L.L., Tambasco, A.J., Tambasco, M.D. and Regitano, L.C.A. (2000). Caracterização molecular de animais da raça Nelore utilizando microssatélites e genes candidatos. Rev. Bras. de Zoot. 29: 1044-1049. Vasconcellos, L.P.M.K., Tambasco-Talhari, D., Pereira, A.P., Coutinho, L.L. and Regitano, L.C.A. (2003). Genetic characterization of Aberdeen Angus cattle using molecular markers. Genet. Mol. Biol. 26: 133-137. Weir, B.S. (1996). Genetic Data Analysis: Methods for Discrete Population Genetic Data. 2nd edn. Sinauer Associates, Sunderland, MA, USA. Wright, S. (1950). Genetical structure of populations. Nature 166: 247-249. |
|