![]()
![]()
![]()
![]()
![]()
![]()
![]()
![]()
![]()
![]()
![]()
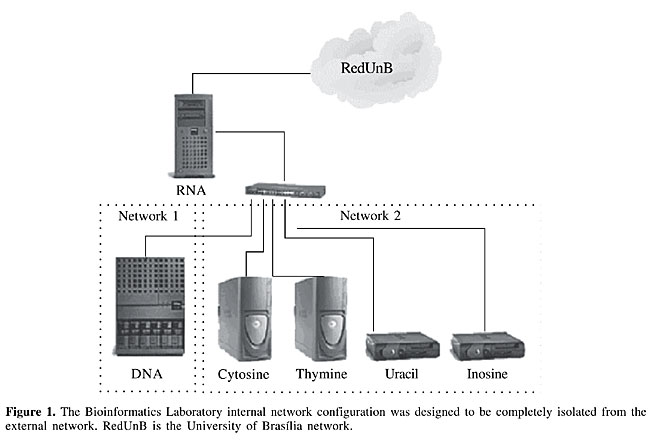
ABSTRACT. Paracoccidioides brasiliensis is the etiological agent of paracoccidioidomycosis, an endemic mycosis of Latin America. This fungus presents a dimorphic character; it grows as a mycelium at room temperature, but it is isolated as yeast from infected individuals. It is believed that the transition from mycelium to yeast is important for the infective process. The Functional and Differential Genome of Paracoccidioides brasiliensis Project - PbGenome Project was developed to study the infection process by analyzing expressed sequence tags - ESTs, isolated from both mycelial and yeast forms. The PbGenome Project was executed by a consortium that included 70 researchers (professors and students) from two sequencing laboratories of the midwest region of Brazil; this project produced 25,741 ESTs, 19,718 of which with sufficient quality to be analyzed. We describe the computational procedures used to receive process, analyze these ESTs, and help with their functional annotations; we also detail the services that were used for sequence data exploration. Various programs were compared for filtering and grouping the sequences, and they were adapted to a user-friendly interface. This system made the analysis of the differential transcriptome of P. brasiliensis possible. Key words: Paracoccidioides brasiliensis, Differential transcriptome, Expressed sequence tags, Automatic annotation, Bioinformatics INTRODUCTION Paracoccidioides brasiliensis is the etiological agent of paracoccidioidomycosis, an endemic mycosis of humans that mainly affects the rural community in South and Central America. In vitro, and probably in nature, this fungus has a dimorphic character; it is found as a mycelium (M) or spores at room temperature, or as a yeast (Y) at temperatures around 37°C, the latter form being prevalent in patient tissues. Inhalation of spores or mycelial fragments is the primary form of infection. When P. brasiliensis infects the host, dimorphic transition occurs from mycelium (or spore) to the yeast form, probably activated by the temperature change. These observations strongly suggest that the dimorphic transition is an important event for infection (Restrepo et al., 2001). Dimorphism is a common characteristic of human pathogenic fungi, as we can see in Candida albicans and Histoplasma capsulatum, though it is a poorly understood process. Consequently, the study of molecular events involved in dimorphism is very important for understanding the biology of P. brasiliensis, even more so considering that it is an experimental model for the study of eukaryotic cell differentiation. San Blas et al. (2002) suggested that the dimorphic process occurs in four steps: a) perception of the external stimulus, b) signal transduction, c) modification of gene expression, and d) structural reorganization, leading to morphological modifications. In this context, there have been many studies of the first two steps, while the third step is still poorly understood in many organisms, including P. brasiliensis. The PbGenome Project aims to identify the transcribed genes of M and Y cell-types of P. brasiliensis separately, those related to dimorphic transition being of particular interest, as they could be key to a better comprehension of the pathobiology of this fungus. In the PbGenome Project, we tried to learn more about the cellular differentiation of the fungus at a molecular level by means of massive identification and annotation of P. brasiliensis genes. Specifically, we wanted to find the specific genes involved in each phase by analyzing expression sequence tags - ESTs. The PbGenome Project involved a consortium that included 70 researchers (professors and students) from two sequencing and data-mining laboratories in the Midwest region of Brazil; it produced 25,741 ESTs (of which 19,718 had sufficient quality to be included in the analysis). We describe the computational procedures to receive, process, analyze, and help with the functional annotation of these ESTs, and also detail the services provided to help with data mining. Various programs were compared for sequence filtering and grouping, and they were adapted to a user-friendly interface. This system made the study of the differential transcriptome of P. brasiliensis possible. MATERIAL AND METHODS cDNA libraries Libraries were constructed on a lambdaZap vector (Stratagene), from poly-A+ RNA isolated from M and Y cells of P. brasiliensis strain Pb01 grown in liquid media, as described elsewhere (Felipe et al., 2003). cDNA clones were prepared according to Felipe et al. (2003) or by in vitro excision, following the manufacturer’s indications (Stratagene). Computational systems Automatic sequencing All clones were sequenced by MegaBace® 1000 (GE Healthcare), using the manufacturer’s dye terminator system. Each sequenced plaque had 96 randomly selected cDNA clones. Hardware and Operating Systems The Bioinformatics Laboratory was set up to support the PbGenome Project and other genome sequencing projects of the Brazilian Midwest region. The Bioinformatics Laboratory had a network composed of the following machines:
Dell PowerVault® 120T DLT1 Autoloader (Support for DLT tapes 40/80 GB, 7 slots). This unit was designated to backup the information generated by the project. The operating systems of these machines, chosen for their stability, security and free use, were OpenBSD version 3.1 for RNA, and Linux RedHat for DNA, CYTOSINE, THYMINE, URACIL, and INOSINE. The Bioinformatics Laboratory network was projected so that only one machine, the RNA, managed the network. RNA accessed all machines: DNA, workstations and terminals. Internal network was divided into two subnetworks: one containing DNA (Network 1), isolated from the other machines because it was responsible for data storage and processing, and the second network containing the other machines - CYTOSINE, THYMINE, URACIL, and INOSINE (Network 2; Figure 1). Therefore, the workstations and terminals could access DNA and vice-versa through RNA. DNA provided http (Hyper Text Transfer Protocol), the basic service of the PbGenome Project, because the computational system was developed and oriented to the web.
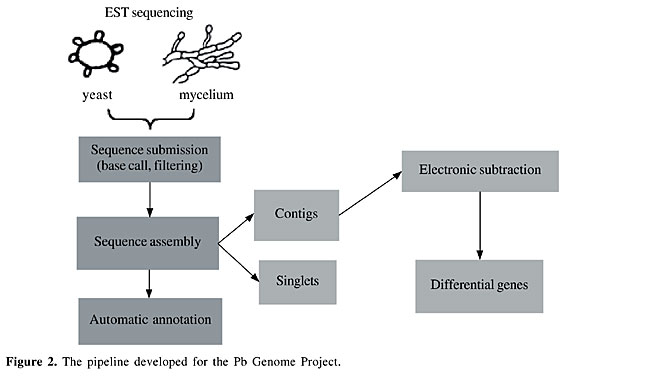
Software - automatic processing We developed a pipeline for the PbGenome Project, divided into three steps: sequence submission, sequence assembly and automatic annotation (Figure 2). We also developed another form of computational analysis, electronic subtraction, to select putative differentially expressed genes.
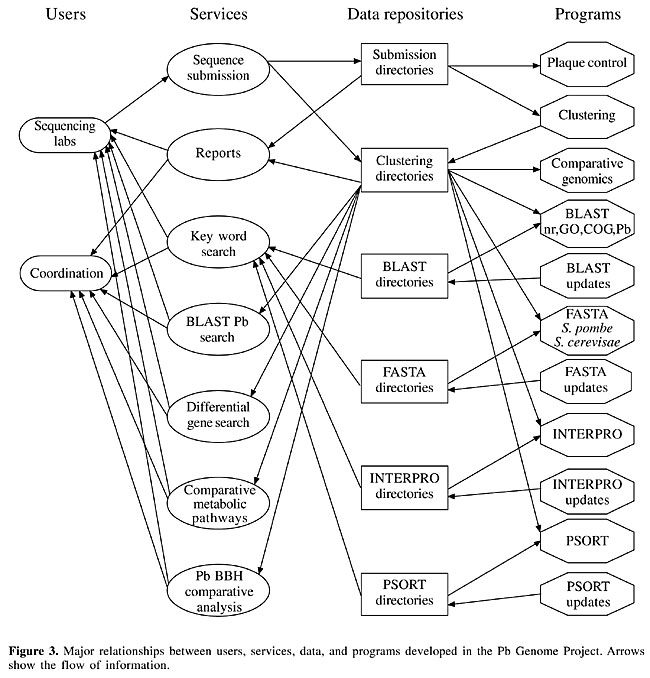
Sequence submission Sequences produced by the biology laboratories and sequenced on MegaBace® were transferred to the Bioinformatics Laboratory, using an html protocol. A compressed binary file (.zip), with the 96 electropherograms, corresponding to the 96 cDNA clones of a given plaque, was transferred by the user and stored on operating system directories. After decompressing this file, each sequence was decoded (base-calling procedure) by the PHRED program (Ewing et al., 1998a), using default parameters. These sequences were filtered to remove contaminants (vectors and bacterial sequences) with the Cross_match program (Green, 1996) or the Seqclean program (www.tigr.org). Each decoded filtered sequence containing more than 100 bases with PHRED quality ³20 (Ewing and Green, 1998b) was stored in fasta format, together with the corresponding quality file PHRED. These two files (bases and quality) formed the primary EST directories. Sequence assembly Sequences of primary EST directories were assembled using two different programs. The first was CAP3 (Huang and Madan, 1999), using each EST directly for assembly. The second was TIGR TGICL (www.tigr.org), which initially makes a grouping using MegaBLAST and thereafter makes an assembly using CAP3 for each group generated in the first step. Both programs generated groups, corresponding to contigs (groups containing more than one EST) and singlets (groups with only one EST). Automatic annotation For each group obtained from the sequence assembly, we executed an automatic annotation step. The results were used by the annotators (biology personnel from both laboratories) to decide on the final annotation. The automatic annotation used Blastx (Altschul et al., 1997), Fasta (Pearson and Lipman, 1988), InterPro (Apweiler et al., 2001, www.ebi.ac.uk/interpro/) and PSORT (Nakai and Horton, 1999). Blastx was executed against three databases: the GenBank complete and non-redundant database (nr), Gene Onthology - GO (www.geneontology.org) and Cluster of Orthologous Groups - COG (www.ncbi.nlm.nih.gov/COG/). The Fasta program was used with predicted polypeptide databases from two genomes, Saccharomyces cerevisiae and Schizosaccharomyces pombee. These results were displayed on a web page. Electronic subtraction To identify specific transcripts of each form of P. brasiliensis, ESTs from both cellular forms were joined into a single database and sequence assembly was performed on all ESTs. Each contig was analyzed to compute the number of M and Y sequences. Each contig could then be described by its percentage of M and Y sequences, which defined specific, preferential and common transcripts. These percentages were used to highlight potential differentially expressed genes. Computational methods From a computational point of view, the PbGenome Project may be seen as a large data repository and as a provider of internet-based services for biologists. Figure 3 shows the major relationships between users, services, data, and programs in the project.
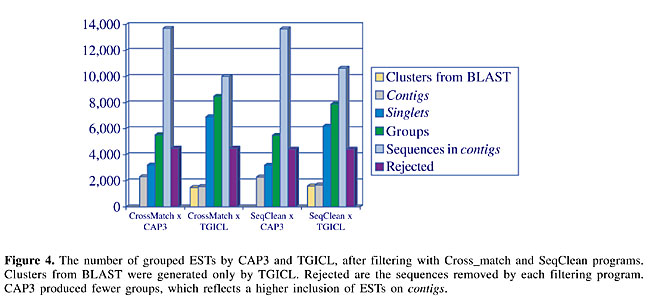
Data include P. brasiliensis ESTs and the outputs of EST assembly and of the programs used for automatic annotation, as well as the several reports to assist biologists in their analysis, along with the diverse global reports from the project. In our diagrammatic scheme (Figure 3), sequencing labs are the laboratories that made the biological and sequencing experiments. These users also decided the final annotation. Coordination includes the general coordinator and the laboratory coordinators. We developed a set of services for the pipeline: sequence submission: allowed the sequencing laboratories to submit their DNA sequences using the World Wide Web; reports: on the sequence submission step of the pipeline, the user could see all the sequences, and their corresponding qualities, of a submitted plaque; the coordinator and each user could see all plaques, the total number of sequences submitted by each user, and the total number of submitted sequences; contigs and singlets generated on the sequence assembly phase, with graphs showing the percentage of M and Y for all groups, a list of differential genes, and so on; key word search: based on key words informed by the user, a list of the groups in which they appear was produced; BLAST Pb search: the user could compare a sequence with a database containing P. brasiliensis sequences, using BLAST tools; differential gene search: a list with the differential genes was produced; comparative metabolic pathways: we included metabolic pathways from KEGG (Kanehisa and Goto, 2000; www.genome.ad.jp) comparing metabolic pathways of P. brasiliensis, S. cerevisae and H. sapiens; Pb BBH comparative analysis: a comparative analysis among a set of related fungi was made, using bidirectional best hit (BBH) technique (Almeida, 2002); submission directories, clustering directories, BLAST directories, FASTA directories, INTERPRO directories, and PSORT directories: data from ESTs, assembly of these sequences on groups of sequences with similarities, and the results of BLAST, FASTA, INTERPRO, and PSORT were all stored in data repositories; plaque control: a set of programs that received cDNA sequences, used the PHRED program to transform the electropherograms on .phd files and store them with their corresponding quality files on .qual files, use PHD2FASTA program to transform these files into .fasta files, use Cross_match program to filter vector and bacterial sequences, and print reports for the user; clustering: uses CAP3 program to group sequences; comparative genomics: uses the BBH tool (Almeida, 2002) to make a comparative analysis of P. brasiliensis, Candida albicans, Saccharomyces cerevisiae, Aspergillus nidulans, and Neurospora crassa; BLAST, FASTA, INTERPRO, PSORT: automatic annotation used these programs, noting that we used Blastx with nr, GO and COG databases, and FASTA with S. cerevisae and S. pombee databases; BLAST updates, FASTA updates, INTERPRO updates, PSORT updates: programs for updates were developed to use the most recent versions of these sequence databases. The computational systems and methods are detailed in Oliveira and Inoue (2002). RESULTS Comparison of Cross_match and SeqClean filtering ESTs obtained from a cDNA library may contain contaminant sequences that must be removed before the assembly and annotation phases. We tested two programs for filtering the contaminants, Cross_match (Green, 1996, www.phrap.org), based on pairwise alignment using the Smith-Waterman algorithm (Smith and Waterman, 1981), and SeqClean (www.tigr.org), based on Blast (Altschul et al., 1997). Both programs compare a sequence group with a database formed by vectors and bacterial sequences. In our project, Cross_match and SeqClean programs removed approximately 20% of all sequences (21.0 and 20.7%, respectively); Cross_match excluded more sequences (4,506) than did SeqClean (4,439). Comparison of TGICL and CAP3 assemblies EST assembly allows a better transcriptome data set because it groups related ESTs in a single contig relative to only one transcript. We compared two different assembly programs. In the first one, all ESTs were used as input for the CAP3 program, resulting in contigs (that have consensus sequences representing the clusterised ESTs) and singlets (ESTs not grouped with any other). Clustering aligns similar sequences, and so the hypothesis is that each contig represents a single transcript. We used another program, TGICL, which first groups ESTs using BLAST, and then uses the sequences of each group separately, as input for the CAP3 program. TGICL produced 45% fewer contigs than CAP3 (Figure 4); that is, TGICL grouped fewer ESTs on contigs and the number of singlets was greater. Consequently, the number of groups, indicating the number of transcripts, was lower in the analysis made by CAP3 than by TGICL.
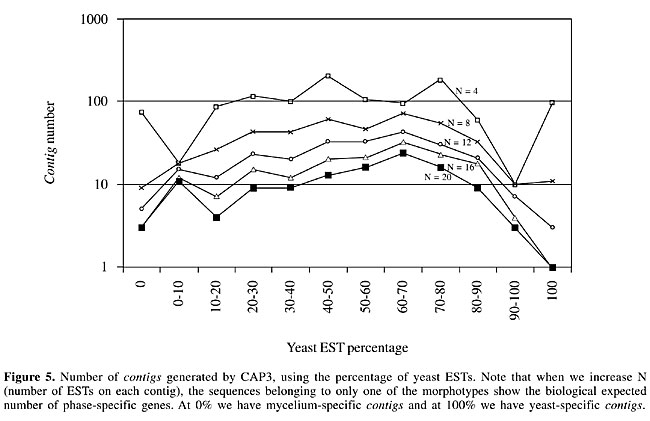
Electronic subtraction We computed the percentage of M and Y sequences on each contig, which defined specific, preferential and common transcripts. In Figure 5 we can see the group distribution according to the EST frequency of each cellular type.
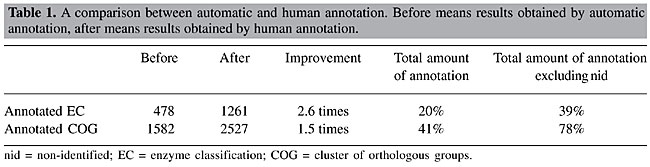
Annotation Automatic annotation was obtained from the results shown in a web page for each group. The programs BLAST, FASTA, INTERPRO, and PSORT were precisely executed to assist the annotators. Biologist annotators used this automatic annotation to discover genes and gene products, to associate with a functional classification, as well as an enzymatic activity, if it were the case. The human analysis of the computational outputs gave more reliability to the annotation, which can be observed by the increase in the group numbers that had a functional categorization and an enzymatic activity determined (Table 1).
The annotator could use a reliability parameter in his analysis, which allowed him to classify the annotation as non-conclusive or non-identified. The former included groups in which the data did not allow reliability for the group function, due to a bad alignment or due to uncertainty about decisions concerning ambiguous functions (for example, enzymatic activity could be performed on more than one substract). Non-identified was used for groups with bad alignments (two high BLAST E-values) or inconsistency among the automatic annotation results. These groups were considered as non-annotated, which means that functions were not associated with them. We have reliably annotated 35% of the groups, which when taken together with the non-conclusive ones resulted in 62% of groups with a determined or presumptive function. Conversely, almost 38% did not have any inferred function and were annotated as non-identified. DISCUSSION Primary EST database Sequences produced by MegaBace sequencer were transferred to the Bioinformatics Laboratory using a web interface. This made the system more flexible, with an immediate visualization of sequence quality, since each plaque was processed as soon as it was received, giving the user the number of valid sequences (at least 100 bases with PHRED quality 20), with their respective qualities. The decision to include the plaque in the project must be done by the user who transferred the plaque. If he considered that a new sequencing was not necessary, he transferred the plaque to a permanent EST directory. This directory stored all sequences submitted to the project. The processing of the submitted EST directories included deletion of bad quality sequences (less than 100 bases with PHRED quality ³20), and filtering away vector and bacterial sequences. The Cross_match program was more efficient than SeqClean, detecting a higher number of vector sequences. Probably, Cross_match was better because it uses the Smith-Waterman algorithm, a good algorithm to detect similarities between two sequences. This program is currently in use for cleaning and deletion of vector and bacteria sequences. Only the filtered sequences were used for assembly and annotation; they formed the primary EST database. Assembly We assembled similar sequences to reduce EST information redundancy, which allowed a better visualization of the expressed genes. Individual analysis of an EST may not add new information, as some transcripts can represent up to 10% of the transcriptome. CAP3 was used to make fragment assembly of similar sequences and to produce consensus sequences with higher base quality for each of the grouped sequences. This assembly procedure can build a contig with sequences that did not come from the same cDNA, generating an error rate concerning the real number of transcripts. For this reason, some research groups use a preliminary step for the assembly phase with another algorithm to make a first clustering of similar sequences. TGICL is a program that initially executes MegaBlast for each sequence pair and groups sequences with high similarities, and then runs CAP3 for each group generated in the first step. We compared CAP3 with TGICL. We noted that some parameters could be tested in this comparison, such as the criterion of inclusion in a group by BLAST, or the criterion of inclusion in groups by CAP3. Sequence quality is also a relevant factor, when we consider that sequencing and experimental errors may or may not include a sequence in a contig. In this project, the previous grouping with BLAST excluded many sequences from the contigs, which increased the number of singlets. But the BLAST algorithm does not use base qualities for comparison, and some sequence exclusion could be caused by differences in low-quality regions. CAP3, on the other hand, includes base quality in the assembly criteria, and it may be more flexible for discrepancies in regions with lower quality. The exclusion observed in the first step of TGICL generated 50% more groups, in comparison with CAP3. These differences could lead to wrong interpretations concerning the total size of the transcriptome and must be carefully studied.We observed that the algorithm made a good alignment in the assembly with CAP3, in the sense that it separated very closely related sequences, because of deletions such as could be seen in retroelements of the same family (data not shown). We used output from CAP3 alone in this project. Electronic subtraction We assembled ESTs from both M and Y forms of P. brasiliensis to discover differentially expressed transcripts. The number of ESTs of each form, on each contig, was the chosen criterion. We observed that with only a few ESTs in a given contig, many genes were already potentially considered differential, and as we increased the minimum number of ESTs per contig, the number of candidates for differential genes decreased. This can be explained by the statistical reliability that increases with the number of ESTs in the contigs (Audic and Claverie, 1997). From PbGenome Project data, and according to this criterion, we labeled as specific contigs those with at least six ESTs. The previously described genes of P. brasiliensis that were known to be differential (Cunha et al., 1999; Venancio et al., 2002; Albuquerque et al., 2004) appeared on contigs entirely dominated by the corresponding cellular type. For example, the M32 gene appeared on a contig with 308 ESTs, with only one isolated from the Y library. Thus, we can conclude that electronic subtraction, as defined in this project, made fast discovery of potential differential transcripts possible. Confirmation of the differential character of the indicated genes depends on experimental confirmation by “Northern blot” or Real-time PCR. Definition of the expressed genes of P. brasiliensis The systematic analysis of ESTs, as presented in the present study, allowed us to separate the expressed genes for both forms of the pathogenic fungus, P. brasiliensis. The number of groups obtained, using Cross_match for filtering and CAP3 for sequence assembly, was 6,022, which is almost 70% of the total estimated number of genes of this species (Gioconda San-Blas, personal communication). This is a large percentage and could help us infer some of the characteristics of fungal metabolism for each of the two forms, as well as some possible mechanisms of immune evasion and virulence. The number of determined enzymatic activities (1261 enzyme classification codes) can be fit into 129 metabolic pathways following KEGG (Kanehisa and Goto, 2000; www.genome.ad.jp), many of which are almost completely represented (data not shown). A manual annotation, based on the automatic one, increased the accuracy of the final results. Also, a revision of the functional classification using the enzyme classification number and the inclusion of a name for the gene product increased reliability (with the group classification as non-conclusive or non-identified). These data allowed a definition of a large part of the P. brasiliensis transcriptome, and the researchers are using it as a sequence repository with an annotated functional profile. This repository is a powerful tool for studies of the biology and pathogenesis of this fungus, and it could be used as a cross-reference source for other mycosis studies. ACKNOWLEDGMENTS Research supported by MCT/CNPq, CNPq, Capes, FUB, UFG, and FUNDECT-MS. We thank Hugo Costa Paes for English revision. REFERENCES Albuquerque, P., Kyaw, C.M., Saldanha, R.R., Brigido, M.M., Felipe, M.S. and Silva-Pereira, I. (2004). Pbhyd1 and Pbhyd2: two mycelium-specific hydrophobin genes from the dimorphic fungus Paracoccidioides brasiliensis. Fungal Genet. Biol. 41: 510-520. Almeida, N.F. (2002). Tools for genome comparison. Doctoral thesis (in Portuguese), Institute of Computing, UNICAMP, Campinas, SP, Brazil. Altschul, S.F., Madden, T.L., Schaffer, A.A., Zhang, J., Zhang, Z., Miller, W. and Lipman, D.J. (1997). Gapped BLAST and PSI-BLAST: a new generation of protein database search programmes. Nucleic Acids Res. 25: 3389-3402. Apweiler, R., Biswas, M., Fleischmann, W., Kanapin, A., Karavidopoulou, Y., Kersey, P., Kriventseva, E.V., Mittard, V., Mulder, N., Phan, I. and Zdobnov, E. (2001). Proteome Analysis Database: online application of InterPro and CluSTr for the functional classification of proteins in whole genomes. Nucleic Acids Res. 29: 44-48. Audic, S. and Claverie, J.M. (1997). The significance of digital gene expression profiles. Genome Res. 7: 986-995. Cunha, A.F., Sousa, M.V., Silva, S.P., Jesuino, R.S., Soares, C.M. and Felipe, M.S. (1999). Identification, N-terminal region sequencing and similarity analysis of differentially expressed proteins in Paracoccidioides brasiliensis. Med. Mycol. 37: 115-121. Ewing, B. and Green, P. (1998b). Base-calling of automated sequencer traces using Phred. II. Error probabilities Genome Res. 8: 186-194. Ewing, B., Hillier, L., Wendl, M. and Green, P. (1998a). Base-calling of automated sequencer traces using Phred. I. Accuracy assessment. Genome Res. 8: 175-185. Felipe, M.S., Andrade, R.V., Petrofeza, S.S., Maranhao, A.Q., Torres, F.A., Albuquerque, P., Arraes, F.B., Arruda, M., Azevedo, M.O., Baptista, A.J., Bataus, L.A., Borges, C.L., Campos, E.G., Cruz, M.R., Daher, B.S., Dantas, A., Ferreira, M.A., Ghil, G.V., Jesuino, R.S., Kyaw, C.M., Leitao, L., Martins, C.R., Moraes, L.M., Neves, E.O., Nicola, A.M., Alves, E.S., Parente, J.A., Pereira, M., Pocas-Fonseca, M.J., Resende, R., Ribeiro, B.M., Saldanha, R.R., Santos, S.C., Silva-Pereira, I., Silva, M.A., Silveira, E., Simoes, I.C., Soares, R.B., Souza, D.P., De-Souza, M.T., Andrade, E.V., Xavier, M.A., Veiga, H.P., Venancio, E.J., Carvalho, M.J., Oliveira, A.G., Inoue, M.K., Almeida, N.F., Walter, M.E., Soares, C.M. and Brigido, M.M. (2003). Transcriptome characterization of the dimorphic and pathogenic fungus Paracoccidioides brasiliensis by EST analysis. Yeast 20: 263-271. Green, P. (1996). PHRAP Documentation. University of Washington, Seattle, WA, USA. [http://bozeman.mbt.washington.edu/phrap.docs/phrap.html]. Accessed March 2001. Huang, X. and Madan, A. (1999). CAP3: A DNA sequence assembly program. Genome Res. 9: 868-877. Kanehisa, M. and Goto, S. (2000). KEGG: Kyoto encyclopedia of genes and genomes. Nucleic Acids Res. 28: 27-30. Nakai, K. and Horton, P. (1999). PSORT: a program for detecting sorting signals in proteins and predicting their subcellular location. Trends Biochem. Sci. 24: 34-35. Oliveira, A.G. and Inoue, M.K. (2002). Bioinformatics Laboratory of the Functional and Differential Genome Project of Paracoccidioides brasiliensis Fungus - Pb Genome Project. Undergraduate final project (in Portuguese), Department of Computer Science, University of Brasília, Brasília, DF, Brazil. Pearson, W.R. and Lipman, D.J. (1988). Improved tools for biological sequence comparison. Proc. Natl. Acad. Sci. USA 85: 2444-2448. Restrepo, A., McEwen, J.G. and Castaneda, E. (2001). The habitat of Paracoccidioides brasiliensis: how far from solving the riddle? Med. Mycol. 39: 233-241. San Blas, G., Nino-Vega, G. and Iturriaga, T. (2002). Paracoccidioides brasiliensis and paracoccidioidomycosis: molecular approaches to morphogenesis, diagnosis, epidemiology, taxonomy and genetics. Med. Mycol. 40: 225-242. Smith, T.F. and Waterman, M.S. (1981). Identification of common molecular subsequences. J. Mol. Biol. 147: 195-197. Venancio, E.J., Kyaw, C.M., Mello, C.V., Silva, S.P., Soares, C.M., Felipe, M.S. and Silva-Pereira, I. (2002). Identification of differentially expressed transcripts in the human pathogenic fungus Paracoccidioides brasiliensis by differential display. Med. Mycol. 40: 45-51. |
|