![]()
![]()
![]()
![]()
![]()
![]()
![]()
![]()
![]()
![]()
![]()
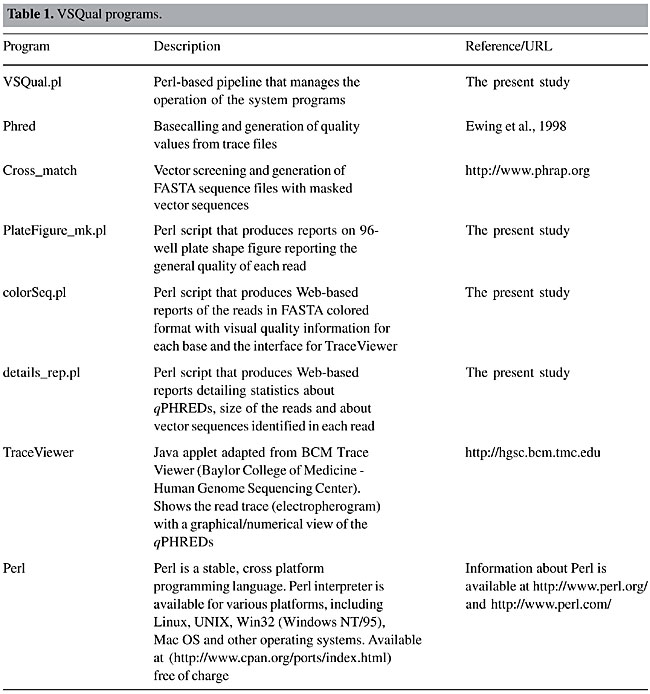
ABSTRACT. A lack of pliant software tools that support small- to medium-scale DNA sequencing efforts is a major hindrance for recording and using laboratory workflow information to monitor the overall quality of data production. Here we describe VSQual, a set of Perl programs intended to provide simple and powerful tools to check several quality features of the sequencing data generated by automated DNA sequencing machines. The core program of VSQual is a flexible Perl-based pipeline, designed to be accessible and useful for both programmers and non-programmers. This pipeline directs the processing steps and can be easily customized for laboratory needs. Basically, the raw DNA sequencing trace files are processed by Phred and Cross_match, then the outputs are parsed, reformatted into Web-based graphical reports, and added to a Web site structure. The result is a set of real time sequencing reports easily accessible and understood by common laboratory people. These reports facilitate the monitoring of DNA sequencing as well as the management of laboratory workflow, significantly reducing operational costs and ensuring high quality and scientifically reliable results. Key words: DNA sequence analysis software, Perl programming, Bioinformatics INTRODUCTION With the recent advances in biotechnological research, most laboratories have access to modern automated DNA sequencing machines that give rise to vast amounts of data with little hands-on laboratory time. Consequently, enormous amounts of raw sequencing data are generated and, for this reason, there is a growing need for automated data processing. A basic need for analyzing for raw DNA sequencing data is accurately assessing the sequence of bases and the quality of traces obtained for each read, in a process called basecalling. Since DNA sequencing involves ordering a set of peaks (A, G, C, or T) on a sequencing gel, the process can be quite error-prone, depending on the process of sample preparation, the machine setup, and so on. Commonly, an automated DNA sequencing machine includes basecalling software as part of the processing software, such as ABI PRISM DNA Sequencing Analysis Software (ABI, 1999), which processes raw trace files, translating them into sequences of bases and assigning an N when resolution is not good. Other DNA sequencing systems have component software for basecalling and assessing the quality of the reads. An example is the MegaBACE 1000 DNA Sequencing System from Amersham Pharmacia/Molecular Dynamics (Sunnyvale, CA, USA). However, a more accurate program, like Phred (Ewing et al., 1998), currently the most widely used basecalling software, is generally required to measure the error probability associated with each base through chromatogram analysis. Basecalling software like Phred analyzes trace files (e.g., ab1 trace files from ABI, esd trace files from MegaBACE, or scf standard chromatogram files) and produces a sequence of bases, attaching an assessment of the probability of certainty to each base. The combination of a sequence and the quality values of its bases is called a read [or sequencing read]. The purpose of basecalling is to determine the nucleotide sequence on the basis of peaks in the trace. Because traces (and regions within a trace) are of variable quality, the fidelity of “called” nucleotides is also variable. This accuracy for each called base is measured by base quality scores, which evaluate the real sequence accuracy. The principal goal of Phred analysis is to produce the input files for programs that perform sequence trimming, clustering or assembly (e.g., by Phrap or CAP3) and finishing processes (e.g., by Consed), although it can also be useful for an evaluation of the reads at the time they are obtained, in order to reduce the cost of sequencing by optimizing resource utilization in the laboratory. The inconvenience is the fact that the raw text outputs of Phred are not easily readable and informative for most technicians in the laboratory. To help solve this, we developed a set of Perl (Wall et al., 1996; Stein, 2001) multiplatform programs that constitute the system we call VSQual. This system is directed by a central pipeline that runs Phred and Cross_match, and then parses the output files and produces a set of Web-based visually intuitive reports. MATERIAL AND METHODS VSQual comprises a group of programs (Table 1) that manage the trace files produced by automated DNA sequencing machines, in order to obtain graphically informative reports and to organize the sequencing data obtained in the laboratory. The core program of VSQual is a Perl-based pipeline, designed with flexibility in order to allow it to be modified according to laboratory conditions. This pipeline directs the processing steps and the organization of reports. As a default, VSQual programs run in the following order: 1) Phred, 2) Cross_match, 3) PlateFigure_mk.pl, 4) colorSeq.pl, and 5) details_rep.pl.
Beginning with the trace files, at the first step Phred produces XXX.fasta, XXX.fasta.qual and XXX.scf output files (XXX is the name of the read). The FASTA file (.fasta) contains the sequence of bases determined by Phred for the corresponding read, while the Qual file (.fasta.qual) has a sequence of corresponding quality values for each base on the read. These quality values (qPHRED) are calculated from the estimated probability (p) that the corresponding nucleotide was called incorrectly: qPHRED = -10 · log10(p) (Ewing and Green, 1998). Thus, for example, if Phred is 99.9% sure of a particular basecall then its quality value will be qPHRED = -10 · log10(1 - 0.999) = 30. The second step is to run Cross_match to produce XXX.fasta.screen output files. This file is similar to the XXX.fasta file; however, with the residual vector sequences masked. This is because when a read is obtained from a plasmid insert, it usually starts [and sometimes ends] with part of the sequencing vector, and it is important to remove these undesirable sequences because they can corrupt further sequence analyses by generating false overlaps on clustering or assemblage processes. The Cross_match program uses the Smith-Waterman alignment algorithm to compare each read with a FASTA database of cloning and sequencing vectors within a raw text file called vector.seq. The -screen option is used to tell Cross_match to produce another FASTA file, where the recognized vector sequences are replaced by X (or x, according to the original capitalization). This Phred and Cross_match output files are the basic raw material to PlateFigure_mk.pl, colorSeq.pl and details_rep.pl programs used in the following steps. The third step is carried out by running the PlateFigure_mk.pl program. This program begins with the information from Phred and Cross_match output files and produces a general report for each set of reads from a 96-well plate. The report is produced in HTML format and shows a plate shape figure where the overall quality of the read is shown as a colored button on each well [that represents a read] in the plate. This button is linked to the sequence window report corresponding to that read. In the fourth step, the colorSeq.pl program produces the files required by the TraceViewer and a sequence window report in HTML format for each read. This HTML file has the DNA sequence in FASTA colored format and the script to TraceViewer box (TraceViewer is a Java applet program updated from the BCM TraceViewer at http://hgsc.bcm.tmc.edu). The FASTA sequence and the TraceViewer give visual information on the quality of each nucleotide position, based on qPHRED’s. Finally, the fifth step consists of running the details_rep.pl program, which produces a report with details about the overall plate and read by read sequencing information. Both Phred and Cross_match need to be compiled to the operating system in which VSQual will be installed. Source codes of Phred version 000925.c and Cross_match version 0.990329 were obtained from the authors (http://www.phrap.com/priceinfo.htm). Phred and Cross_match are command line-based software written in C++, freely available for academic users. Phred and Cross_match source codes for the Win32 platform were compiled using gcc compiler of Cygwin (http://www.cygwin.com/). On this platform, Cygwin was also used as the interface for running VSQual, since it allows a UNIX environment within Windows. To run the system, it is necessary to inform the directory where the subdirectories with plate sets of chromatograms are saved (not necessarily on the server disk). VSQual collects the information about the name of the subdirectories within the specified directory, compares it with a log file and processes all new subdirectories. Thus, in the case that there is a need to reanalyze all plates of the directory, it is necessary to erase the log file. RESULTS In our laboratory, VSQual produces Web-based graphical reports, and adds them to a Web site structure, running on an Apache 1.3.31 Web server. These reports are then ready to be accessed through the intranet/Internet using any Web browser. Examples of the VSQual reports are shown in Figures 1, 2 and 3 and an online version can be accessed at http://www.cnpso.embrapa.br/bioinformatica/.
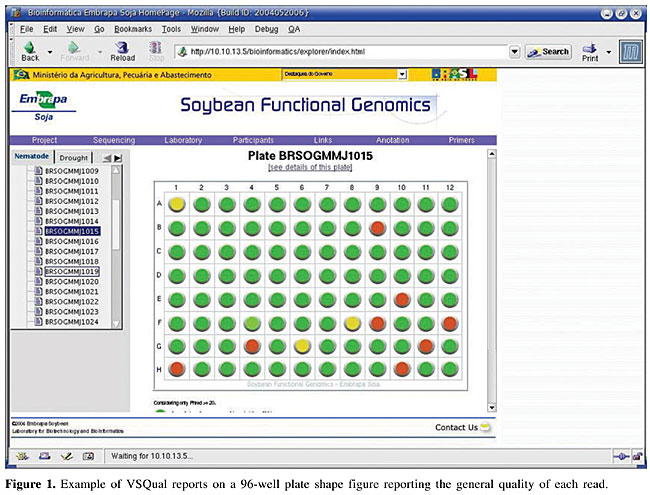
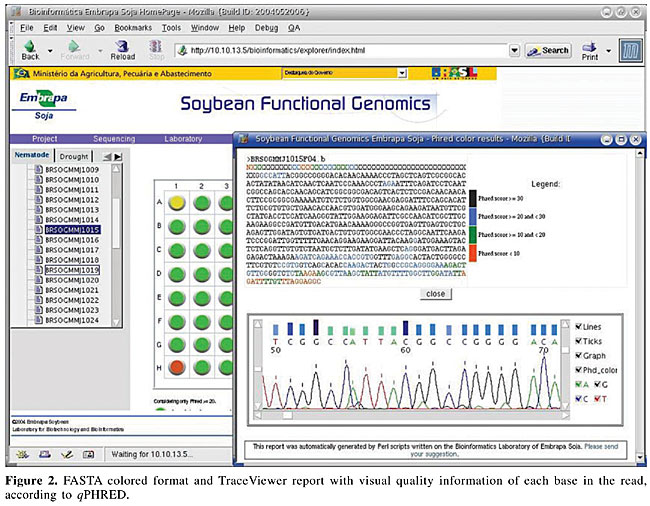
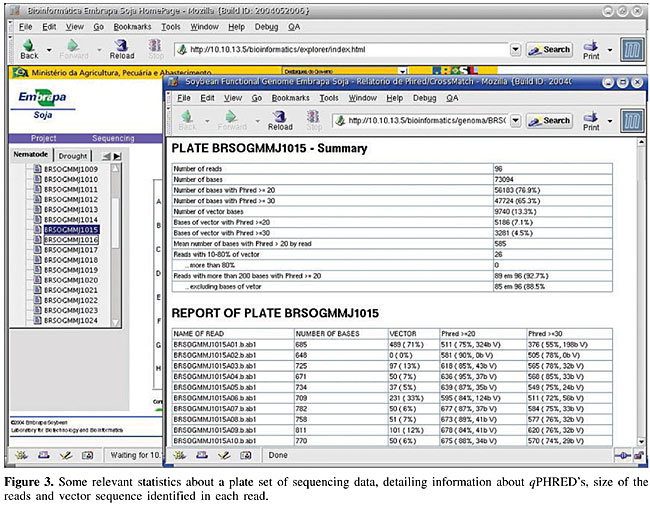
Figure 1 presents an example of the overall quality information report of a set of reads in a 96-well plate. It is shown in a plate shape figure, where the quality of the read in each well is reported as a colored button. In this report, as default, green stands for an insert fragment of 200 or more bases with qPHRED ³20, yellow stands for a vector fragment of 200 or more bases with qPHRED ³20 if the first statement was not true, and red stands for lower quality sequences. These minimal parameters (qPHRED and fragment size) are adjustable by the VSQual user. The 96-well shape report functions as a fully clickable map, each button giving access to a new window showing the corresponding read on FASTA colored format and the TraceViewer box. Figure 2 displays an example of this window, where, for each DNA sequence read, a visually informative report is accessible with quality information for each base, according to qPHRED’s. As a default, red stands for qPHRED <10, green stands for qPHRED ³10 and <20, blue stands for qPHRED ³20 and <30, and black stands for qPHRED ³30; but these parameters can be easily customized on colorSeq.pl script. In addition, chromatogram quality features can be accessed on the TraceViewer box in this window. Another report shows some statistics about the set of data from a plate, such as number of reads, number of bases, number of bases with qPHRED ³20, number of bases with qPHRED ³30, number of vector bases, bases of vector with qPHRED ³20, bases of vector with qPHRED ³30, mean number of bases with qPHRED >20 by read, reads with 10-80% of vector/more than 80%, reads with more than 200 bases with qPHRED ³20/excluding bases of vector. Also some relevant information is reported about each read, such as the name of the read, number of bases obtained, number of vector bases masked, number of bases scored with qPHRED ³20 and qPHRED ³30, and detailed information about the vector residual sequence identified in the read (Figure 3). VSQual was developed with Perl version 5.8.2 and tested on RedHat Linux versions 8.1 and 9.0, Mandrake Linux version 10.0 and Windows 2000. We expect no problems when using VSQual on any other computer operating system for which Perl is available (including Linux, Unix®, Microsoft® Windows®, and Mac® OS). The performance of all the VSQual programs was tested and validated using ab1 trace files from ABI PRISM 3100 Genetic Analyzer, Perkin-Elmer Applied Biosystems (Foster City, CA, USA) and esd trace files from MegaBACE 1000 DNA Sequencing System from Amersham Pharmacia/Molecular Dynamics. The assurance of the VSQual programs was assessed by manually comparing the outputs with the raw data used as input for each program. DISCUSSION Automated DNA sequencing machines, such as ABI PRISM 3100, 3700 or 3730, and MegaBACE use capillary electrophoresis and allow sequencing sets of 96 or 384 samples using highly automated procedures. Since the sequencing effort on our laboratory is organized in 96-well plates, VSQual programs were designed to handle 96-well plate sets but it can be customized to operate 384-well sample sets with few script changes. In a DNA sequencing effort like ours, the principal goal is to obtain informative sequences (e.g., that encode proteins which determine cellular metabolism, or sequences that regulate the expression of genes or other cellular processes). Thus, multiple sequencing reactions on both strands of a cloned DNA molecule are usually required to insure accuracy. However, when single-pass sequencing of random clones from cDNA libraries is used to obtain expressed sequence tags (ESTs), time and cost are reduced at the expense of some accuracy. Hence, it is evident that the higher the level of accuracy obtained on DNA sequencing, the more reliable the results obtained and consequently, resource usage is optimized. An efficient method to assess the quality of reads generated in real time can significantly reduce the operational costs of any DNA sequencing effort, since any problems with the preparation of samples, capillaries, etc., can be tracked and corrected in time. Some commercial packages are available to facilitate automated DNA sequence analysis, for example, SequencherTM Gene Codes (Ann Arbor, MI, USA), CodonCode (http://www.codoncode.com/), and Geospiza (http://www.geospiza.com/), but often such packages are excessively expensive and do not cover all laboratory needs. Also, an inconvenience is that most of these software solutions require massive user intervention, or they have modules that need advanced knowledge of the system to allow implementation in automated pipelines. Investments in sophisticated and rigid pipelines might be justified for large laboratories/large projects but can be too expensive for smaller laboratories. Alternatively, some software solutions are available that perform these tasks at low cost, such as Staden Package (Staden et al., 2000) and Bioperl (Stajich et al., 2002; http://www.bioperl.org/). The Staden Package programs provide an intuitive graphical user interface, but they require considerable user intervention and thus, hands-on time. VSQual considerably reduces hands-on analysis time if compared to the Staden package when extracting sequence information from raw sequencing files, since all VSQual reports are available ready to use on the Web. Bioperl is a collection of Perl modules designed to facilitate sequence manipulation, access to biological databases and to parse the output of various programs. However, it does not provide complete programs. A module similar to VSQual is Bio::Seq::SeqWithQuality, which can be used to manipulate sequences with quality data, like those produced by Phred. The inconvenience of Bioperl is that the user is responsible for writing the Perl script that holds the modules to achieve the desired task. VSQual allows flexible and easy implementation and usage of a Perl-based pipeline to handle and analyze DNA sequencing data, while requiring only minor or no programming skills. It is a flexible open-source software that can be adapted for different laboratory structures and needs. Another favorable characteristic is that it allows the organization of laboratory workflow in a Web-based environment. Laboratory data is promptly organized and available for all authorized users, providing an easy and low cost way of accessing the sequencing information by all scientists and technicians from anywhere, as soon as it is generated. No more than a web browser is required to access all sequencing data features, with highly reliable information about the quality of the data obtained. ACKNOWLEDGMENTS Research supported by the National Council for Scientific and Technological Development (Conselho Nacional de Desenvolvimento Científico e Tecnológico - CNPq), the Brazilian Agricultural Technology Development Project (Projeto de Apoio ao Desenvolvimento de Tecnologia Agropecuária para o Brasil - PRODETAB), the Japanese International Research Center for Agricultural Sciences (Jircas), and the Brazilian Agricultural Research Corporation (Empresa Brasileira de Pesquisa Agropecuária - Embrapa), through Embrapa Soybean. REFERENCES ABI (1999). ABI PRISM, DNA Sequencing Analysis Software Version 3.6 NT, User’s Manual. PE Applied Biosystems, Foster City, CA, USA. Ewing, B. and Green, P. (1998). Base-calling of automated sequencer traces using Phred. II. Error probabilities. Genome Res. 8: 186-194. Ewing, B., Hillier, L., Wendl, M.C. and Green, P. (1998). Base-calling of automated sequencer traces using Phred. I. Accuracy assessment. Genome Res. 8: 175-185. Staden, R., Beal, K.F. and Bonfield, J.K. (2000). The Staden package, 1998. Methods Mol. Biol. 132: 115-130. Stajich, J.E., Block, D., Boulez, K., Brenner, S.E., Chervitz, S.A., Dagdigian, C., Fuellen, G., Gilbert, J.G., Korf, I., Lapp, H., Lehvaslaiho, H., Matsalla, C., Mungall, C.J., Osborne, B.I., Pocock, M.R., Schattner, P., Senger, M., Stein, L.D., Stupka, E., Wilkinson, M.D. and Birney, E. (2002). The Bioperl toolkit: Perl modules for the life sciences. Genome Res. 12: 1611-1618. Stein, L.D. (2001). Using Perl to facilitate biological analysis. Methods Biochem. Anal. 43: 413-449. Wall, L., Christiansen, T. and Schwartz, R.L. (1996). Programming Perl. 2nd edn. O’Reilly & Associates, Sebastopol, CA, USA. |
|