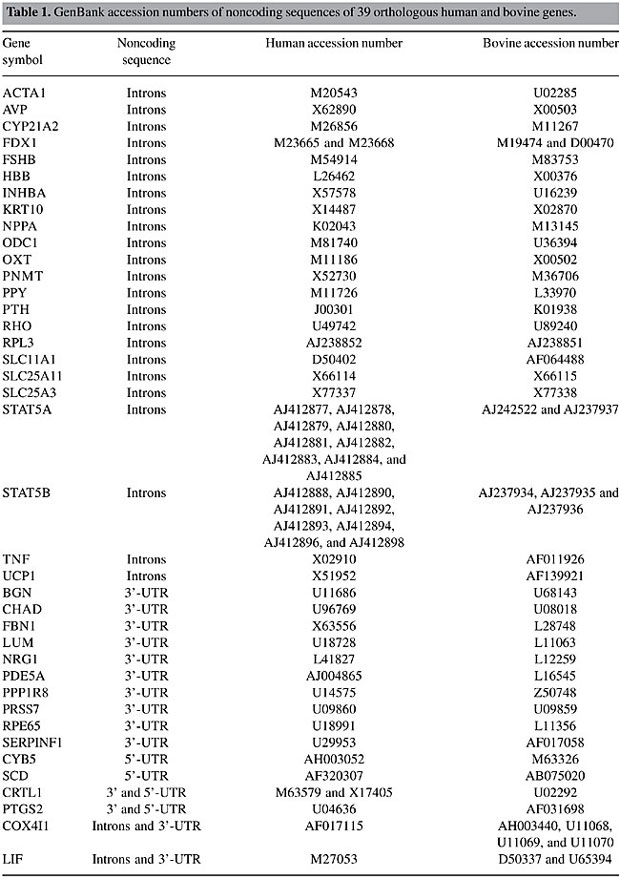
ABSTRACT. Genomic sequence comparison across species has enabled the elucidation of important coding and regulatory sequences encoded within DNA. Of particular interest are the noncoding regulatory sequences, which influence gene transcriptional and posttranscriptional processes. A phylogenetic footprinting strategy was employed to identify noncoding conservation patterns of 39 human and bovine orthologous genes. Seventy-three conserved noncoding sequences were identified that shared greater than 70% identity over at least 100 bp. Thirteen of these conserved sequences were also identified in the mouse genome. Evolutionary conservation of noncoding sequences across diverse species may have functional significance, and these conserved sequences may be good candidates for regulatory elements. Key words: Genes, DNA sequences, Bovine, Comparative analysis, Orthologous INTRODUCTION Increasing interest in genome structure and function has resulted in improved tools for comparative genomics. Putative coding and regulatory sequences have been identified by genomic sequence analysis of diverse species. Noncoding sequences have been shown to influence gene transcriptional and posttranscriptional processes (Huang and Gorman, 1990; Liu and Redmond, 1998; Wedemeyer et al., 2000; Mazumber et al., 2003). Although noncoding DNA exhibits more sequence variation across species than exons, some of these sequences have been retained by selective pressure (Jareborg et al., 1999). These conserved noncoding sequences (CNS) may be candidate regulatory elements. Phylogenetic footprinting is a method that identifies regulatory elements in nonfunctional DNA, by using alignment-based comparisons of orthologous noncoding sequences from different species (Tagle et al., 1988; Blanchette et al., 2002; Peirce, 2004). This experimental approach identifies important sequences whose function is not clearly understood, based on the idea that important regulatory modules remain under selective pressure during evolution, and comparison of two (or more) genomes will identify the conserved sequences that are most likely to be biologically relevant (Weitzman, 2003). The comparative sequence analyses generally use orthologous genes to identify similarities and differences between genomes. Orthologs are genes that are related by vertical descent from a common ancestor and encode proteins with the same function in different species (Koonin et al., 1996). Previous studies have identified both noncoding sequence conservation (Loots et al., 2000; Batzoglou et al., 2000; Dubchak et al., 2000; Frazer et al., 2001; Chapman et al., 2003; Williams et al., 2003; Lenhard et al., 2003; Nobrega et al., 2003) as well as sequence divergence (Larizza et al., 2002; Cooper et al., 2003). These reports demonstrate that a comparative genomics approach can be an efficient tool for identifying functional sequence elements and for providing insights into the regulation of genomic machinery. Few studies have utilized cattle as a target organism. Comparison of human and rodent sequences comprises the bulk of comparative genomic studies. Human-bovine comparative mapping, however, has revealed a high degree of genetic conservation that is as extensive as human-mouse conservation (Womack, 1987; O’Brien et al., 1988). Using a Zoo-FISH approach, Solinas-Toldo et al. (1995) showed that each human chromosome, except chromosome Y, hybridizes to one or more bovine chromosomes, indicating a high level of conservation between these two organisms. Despite the similarity between human and bovine genomes, most previous efforts that utilized comparison of bovine sequences with other genomes focused on human genome analysis and studied specific human chromosome segments (Thomas and Touchman, 2002; Frazer et al., 2003; Thomas et al., 2003; Williams et al., 2003). Only Hering et al. (1995) focused on the bovine genome, and they identified conservation of bovine, human, pig, chicken, and rat 5’- and 3’-untranslated regions (5’- and 3’-UTR) of the chondrocyte link protein (CRTL1) cDNA sequence. Considering the evidence for human-bovine genetic similarity, and taking into account the economic importance of identifying and understanding regulation of genetic loci associated with desirable traits, we examined sequence conservation and candidate functional elements in noncoding regions of 39 human and bovine orthologous genes. MATERIAL AND METHODS In order to investigate conservation between human and bovine noncoding sequences, we searched 1573 Bos taurus genes from the Bovmap database (http://locus.jouy.inra.fr/; accessed September 2002). Genes that had incomplete mRNA and protein sequences, and that had no noncoding sequences comparable to Homo sapiens sequences present in the Locuslink database (http://www.ncbi.nlm.nih.gov/LocusLink/; Pruitt and Maglott, 2001) were excluded. Moreover, nucleotide and amino acid sequences that showed lesser than 70% identity between humans and bovines were also excluded. Thirty-nine genes were identified as orthologous between humans and bovines. Comparable noncoding sequences of these genes (Table 1) were obtained from the GenBank® database (http://www.ncbi.nlm.nih.gov/GenBank/; Benson et al., 2003) and extracted with the SeqVista graphical tool (Hu et al., 2003). When multiple accessions existed for the same sequence, the longest sequence was chosen. The pairwise human/bovine alignments were performed by Avid alignment algorithm and were displayed with the Vista graphical server (http://www.gsd.lbl.gov/vista/; Bray et al., 2003), both applying default parameters. A CNS was identified as orthologous regions sharing at least 70% sequence identity across at least 100 bp.
Noncoding sequences that showed conservation between human and bovine were analyzed in multispecies comparisons, using the mouse as the third organism. Mouse sequences were obtained from GenBank®. Human/bovine/mouse alignments were performed using Avid alignment algorithm and were displayed using the Vista graphical server (Mayor et al., 2000; Bray et al., 2003). Cutoff criteria for defining actively CNS were calculated using intersection/union analyses available at the Vista server. The actively CNS were identified as the sequences that were conserved in all three pairwise alignments: human-bovine, human-mouse and bovine-mouse. Human/bovine/mouse alignments were displayed using ClustalW (http://www.ebi.ac.uk/clustalw/; Higgins et al., 1994) and Genedoc (http://www.psc.edu/biomed/genedoc/; Nicholas et al., 1997) programs in order to visualize identical nucleotide positions of the actively CNS. RESULTS One hundred and sixteen human/bovine alignments corresponding to 95 introns, fifteen 3’-UTRs and six 5’-UTRs were generated. Twenty-eight of the 39 orthologous genes showed conservation in their noncoding sequences. Seventy-three CNSs with ³70% identity over ³100 bp were obtained in 36 introns, twelve 3’-UTRs and one 5’-UTR, totaling 49 noncoding sequences (Table 2). The CNSs ranged from 101 to 485 bp for introns, from 102 to 1116 bp for 3’-UTRs and 131 bp for 5’-UTRs. The conservation of these CNSs ranged from 70 to 93.7% for introns, from 70 to 91.7% for 3’-UTRs, and 73.3% for the 5’-UTRs.
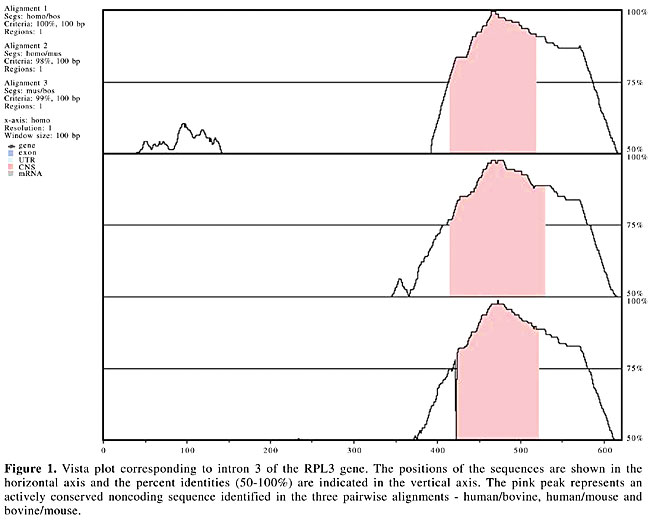
The 49 human and bovine noncoding sequences in which conservation was detected were submitted to multiple alignment analysis with the corresponding orthologous mouse sequences, using the Avid algorithm. Vista plots (Figure 1) were produced to determine actively CNSs in the human/bovine/mouse alignments. Sequence conservation peaked in intron 3 of RPL3 (Figure 1). The cutoff criteria established by intersection/union analyses for each sequence ranged from 51 to 100% conservation over 100 bp for human/bovine alignments, and from 50 to 99% conservation over 100 bp for bovine/mouse alignments.
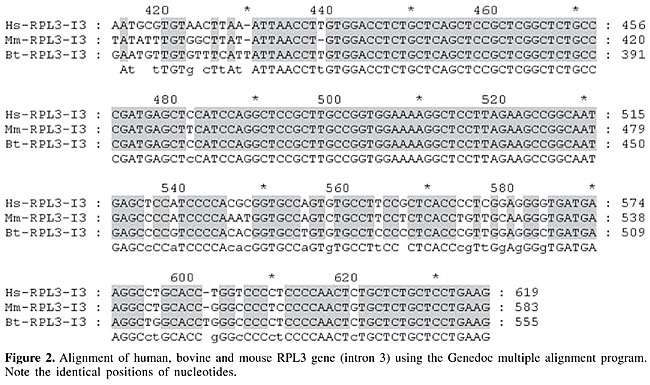
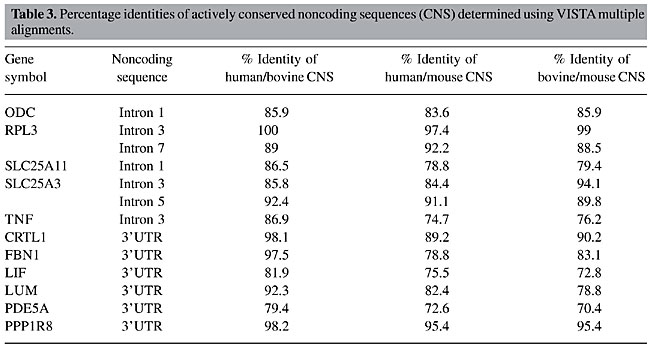
Forty-five human”bovine CNSs were identified by Vista multiple analysis. Of these 45 sequences, 13 exhibited at least 70% conservation in the three pairwise alignments (human/bovine, human/mouse and bovine/mouse) and were considered actively CNSs. The genes that showed actively CNSs in 3’-UTRs included CRTL1, FBN1, LIF, LUM, PDE5A, and PPP1R8, while ODC1, RPL3, SLC25A11, SLC25A3, and TNF showed active conservation in introns. The identical nucleotides of these sequences were verified by Genedoc alignments. An example of the conservation of RPL3 intron 3 is shown in Figure 2.
The percentage identities of all actively CNS identified from the human/bovine/mouse alignments were determined. The most conserved sequence identified was a portion of RPL3 intron 3; the least conserved sequence identified was a portion of PDE5A 3’-UTR (Table 3). The length of the conserved sequences ranged from 92 to 913 bp.
DISCUSSION The objective of our analysis was to identify conservation between human and bovine orthologous noncoding sequences. Our human/bovine comparison is based on phylogenetic footprinting, the principle that important regulatory modules are retained via selective pressure during evolution, and that comparison of at least two divergent genomes can reveal conserved sequences that are most likely to be biologically relevant (Weitzman, 2003). Most of the 3’-UTRs possessed CNSs, while only 36 of 95 introns shared CNSs. There were much more CNSs in 3’-UTRs than in introns, which is in accordance with a previous study that identified highly conserved regions in a set of genes from mammals, birds, amphibians, and bony fishes (Duret and Bucher, 1997). They found that conserved sequences were three times more frequent in 3’-noncoding regions than in introns. The percentage identity that we observed was higher in 3’-UTRs (average identity = 77.2%) than in introns (average identity = 73.2%). This result agrees with the expectation that untranslated regions are more conserved than introns because of their crucial role in post-transcriptional and post-translational processes. Similar results were obtained by Jareborg et al. (1999), who compared 77 orthologous mouse and human gene pairs and found almost 10 times more 90% identical regions in 3’- and 5’-UTRs than in introns. Only 1% of the introns showed this high identity. In our study, the most identical CNSs were those found in FBN1 3’-UTR, which showed 303 bp and 91.7% identity, and in PPP1R8 3’-UTR, which showed 81.2% identity over 1116 bp. One of the six 5’-UTRs possessed a conserved sequence, which was less identical than 3’-UTRs and intron CNSs. The lack of identity of the 5’-UTR conserved sequence is a surprising result because we expected a strong selective pressure on 5’-UTRs, as these sequences contain elements involved in the regulation of transcription (Duret and Bucher, 1997). However, since only one 5’-UTR sequence was analyzed, we cannot generalize about 5’-UTR conservation across the genome. With presumably fewer functional constraints, noncoding sequences can accumulate neutral mutations and can evolve more rapidly than coding portions of the genomes. When a noncoding sequence encodes some regulatory function, selective pressure may drive sequence conservation within the region (Jareborg et al., 1999; Nobrega and Pennacchio, 2004). It is possible that some of the 73 noncoding sequences examined were conserved because of the short divergence time, given the intermediate evolutionary distance (70-100 Myrs) between humans and bovines. In this case, the lack of divergence would interfere with the detection of functional noncoding elements. Thus, it was necessary to compare more than two evolutionary related species. We further examined human/bovine sequence alignments, comparing them to mouse orthologous sequences to check the CNS region. Through multiple analyses, we were able to identify sequences that shared similarities because of functional constraints. Based on human/bovine/mouse alignments, active conservation was detected in six 3’-UTRs and seven introns, totalizing 13 noncoding sequences from 11 genes. Assuming that noncoding sequences that have remained similar during evolution might play roles in gene regulation, the high levels of conservation identified in the assessed sequences may infer functional elements. Apparently, significant similarity exists between human and bovine noncoding gene sequences, and comparative analysis of noncoding sequences between these two genomes provides putative regulatory sequences that can be experimentally tested to confirm if they participate in gene regulation. These results will help elucidate the regulation process of these genes in human and bovine genomes. ACKNOWLEDGMENTS We are grateful to CNPq - Brazil, fellowship number 130541/2002-8, which has supported M.N. Miziara, and to FAPESP, Grant 97/13403-1 to M.E.J. Amaral. We and thank Dr. J.E. Womack and Elaine Owens for many suggestions and for critical reading of the manuscript. REFERENCES Batzoglou, S., Pachter, L., Mesirov, J.P., Berger, B. and Lander, E.S. (2000). Human and mouse gene structure: comparative analysis and application to exon prediction. Genome Res. 10: 950-958. Benson, D.A., Karsch-Mizrachi, I., Lipman, D.J., Ostell, J. and Wheeler, D.L. (2003). Genbank. Nucleic Acids Res. 31: 23-27. Blanchette, M., Schwikowski, B. and Tompa, M. (2002). Algorithms for phylogenetic footprinting. J. Comput. Biol. 9: 211-223. Bray, N., Dubchak, I. and Pachter, L. (2003). AVID: A global alignment program. Genome Res. 13: 97-102. Chapman, M.A., Charchar, F.J., Kinston, S., Bird, C.P., Grafham, D., Rogers, J., Grützner, F., Graves, J.A.M., Green, A.R. and Göttgens, B. (2003). Comparative and functional analyses of LYL1 loci establish marsupial sequences as a model for phylogenetic footprinting. Genomics 81: 249-259. Cooper, G.M., Brudno, M., NISC Comparative Program, Green, E.D., Batzoglou, S. and Sidow, A. (2003). Quantitative estimates of sequence divergence for comparative analyses of mammalian genomes. Genome Res. 13: 813-820. Dubchak, I., Brudno, M., Loots, G.G., Pachter, L., Mayor, C., Rubin, E.M. and Frazer, K.A. (2000). Active conservation of noncoding sequences revealed by three-way species comparisons. Genome Res. 10: 1304-1306. Duret, L. and Bucher, P. (1997). Searching for regulatory elements in human noncoding sequences. Curr. Opin. Struct. Biol. 7: 399-406. Frazer, K.A., Sheehan, J.B., Stokowski, R.P., Chen, X., Hosseini, R., Cheng, J.F., Fodor, S.P., Cox, D.R. and Patil, N. (2001). Evolutionarily conserved sequences on human chromosome 21. Genome Res. 11: 1651-1659. Frazer, K.A., Elnitski, L., Church, D.M., Dubchak, I. and Hardison, R.C. (2003). Cross-species sequence comparisons: a review of methods and available resources. Genome Res. 13: 1-12. Hering, T.M., Kollar, J., Huynh, T.D. and Sandell, L.J. (1995). Bovine chondrocyte link protein cDNA sequence: interspecies conservation of primary structure and mRNA untranslated regions. Comp. Biochem. Physiol. B Biochem. Mol. Biol. 112: 197-203. Higgins, D., Thompson, J., Gibson, T., Thompson, J.D., Higgins, D.G. and Gibson, T.J. (1994). CLUSTAL W: improving the sensitivity of progressive multiple sequence alignment through sequence weighting position-specific gap penalties and weight matrix choice. Nucleic Acids Res. 22: 4673-4680. Hu, Z., Frith, M., Niu, T. and Weng, Z. (2003). SeqVISTA: a graphical tool for sequence feature visualization and comparison. BMC Bioinformatics 4: 1-8. Huang, M.T.F. and Gorman, C.M. (1990). Intervening sequences increase efficiency of RNA 3' processing and accumulation of cytoplasmic RNA. Nucleic Acids Res. 18: 937-947. Jareborg, N., Birney, E. and Durbin, R. (1999). Comparative analysis of noncoding regions of 77 orthologous mouse and human gene pairs. Genome Res. 9: 815-824. Koonin, E.V., Mushegian, A.R. and Borr, P. (1996). Non-orthologous gene displacement. Trends Genet. 12: 334-336. Larizza, A., Makalowski, W., Pesole, G. and Saccone, C. (2002). Evolutionary dynamics of mammalian mRNA untranslated regions by comparative analysis of orthologous human, artiodactyls and rodent gene pairs. Comput. Chem. 26: 479-490. Lenhard, B., Sandelin, A., Mendoza, L., Engström, P., Jareborg, N. and Wasserman, W.W. (2003). Identification of conserved regulatory elements by comparative genome analysis. J. Biol. 2: 13-13.11. Liu, S.-Y. and Redmond, M. (1998). Role of the 3’-untranslated region of RPE65 mRNA in the translational regulation of the RPE65 gene: identification of a specific translation inhibitory element. Arch. Biochem. Biophys. 357: 37-44. Loots, G.G., Locksley, R.M., Blankespoor, C.M., Wang, Z.E., Miller, W., Rubin, E.M. and Frazer, K.A. (2000). Identification of coordinate regulator of interleukins 4, 13, and 5 by cross-species sequence comparisons. Science 288: 136-140. Mayor, C., Brudno, M., Schwartz, J.R., Poliakov, A., Rubin, E.M., Frazer, K.A., Pachter, L.S. and Dubchak, I. (2000). VISTA: visualizing global DNA sequence alignments of arbitrary length. Bioinformatics 16: 1046-1047. Mazumber, B., Seshadri, V. and Fox, P.L. (2003). Translational control by the 3’UTR: the ends specify the means. Trends Biochem. Sci. 28: 91-98. Nicholas, K.B., Nicholas Jr., H.B. and Deerfield II, D.W. (1997). GeneDoc: analysis and visualization of genetic variation. EMBNEW. News 4: 14. Nobrega, M.A. and Pennacchio, L.A. (2004). Comparative genomic analysis as a tool for biological discovery. J. Physiol. 554: 31-39. Nobrega, M.A., Ovcharenko, I., Afzal, V. and Rubin, E.M. (2003). Scanning human gene deserts for long-range enhancers. Science 302: 413. O’Brien, S.J., Seuánez, H.N. and Womack, J.E. (1988). Mammalian genome organization: An evolutionary overview. Annu. Rev. Genet. 22: 323-351. Peirce, J.L. (2004). Following phylogenetic footprints: Researchers apply computational power to their hunt for noncoding regulatory sequences. Scientist 18: 34-37. Pruitt, K.D. and Maglott, D.R. (2001). RefSeq and LocusLink: NCBI gene-centered resources. Nucleic Acids Res. 29: 137-140. Solinas-Toldo, S., Lengauer, C. and Fries, R. (1995). Comparative genome map of human and cattle. Genomics 27: 489-496. Tagle, D.A., Koop, B.F., Goodman, M., Slightom, J.L., Hess, D.L. and Jones, R.T. (1988). Embryonic epsilon and gamma globin genes of a prosimian primate (Galago crassicaudatus). Nucleotide and amino acid sequences, developmental regulation and phylogenetic footprints. J. Mol. Biol. 203: 439-455. Thomas, J.W. and Touchman, J.W. (2002). Vertebrate genome sequencing: building a backbone for comparative genomics. Trends Genet. 18: 104-108. Thomas, J.W., Touchman, J.W., Blakesley, R.W. et al. (2003). Comparative analyses of multi-species sequences from targeted genomic regions. Nature 424: 788-793. Wedemeyer, N., Schmitt-John, T., Evers, D., Thiel, C., Eberhard, D. and Jockusch, H.C. (2000). Conservation of the 3’-untranslated region of the Rab1a gene in amniote vertebrates: exceptional structure in marsupials and possible role for posttranscriptional regulation. FEBS Lett. 477: 49-54. Weitzman, J.B. (2003). Tracking evolution’s footprints in the genome. J. Biol. 2: 9-9.4. Williams, S.H., Mouchel, N. and Harris, A. (2003). A comparative genomic analysis of the cow, pig, and human CFTR genes identifies potential intronic regulatory elements. Genomics 81: 628-639. Womack, J.E. (1987). Genetic engineering in agriculture: Animal genetics and development. Trends Genet. 3: 65-68. |
|


