![]()
![]()
![]()
![]()
![]()
![]()
![]()
![]()
![]()
![]()
![]()
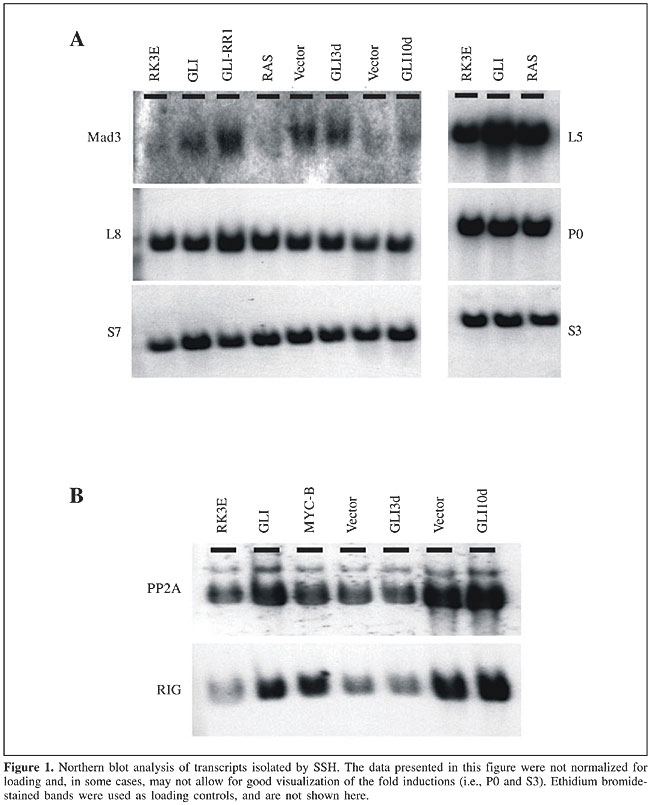
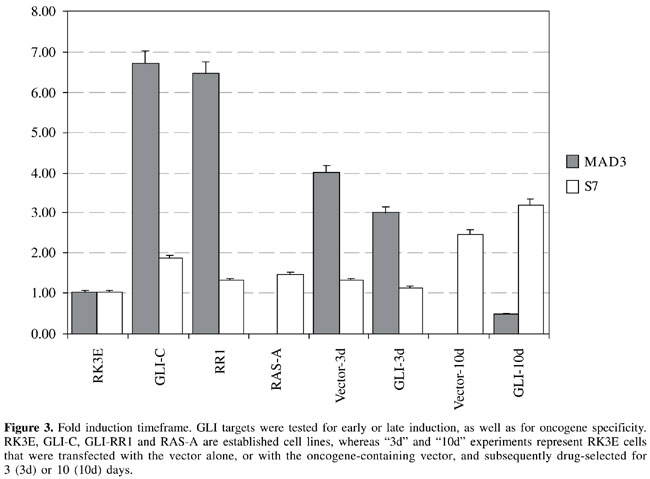
ABSTRACT. Established cell lines have long been used for in vitro studies of tumor biology, enabling investigators to control growth conditions and to draw important conclusions about the oncogenic microenvironment. However, gene expression behavior in cultured cells may not always reflect the actual in vivo scenario, and analysis derived from such experiments should take into consideration the existing differences between the two environments. We used suppression subtractive hybridization to study transcriptional changes elicited after oncogene transformation and cell line establishment. We found that transcriptional changes elicited in cultured cell lines are in fact representative of late events, and they do not occur early after oncogene transfection or activation. We also determined that a fraction of the transcriptional changes is oncogene specific, whereas other changes are shared between two or more different oncogenes. Key words: Tumor biology, Transcriptional patterns, Transformation, Oncogene INTRODUCTION A major goal of cancer investigation is the determination of molecular differences between neoplastic and normal tissue; such differences can be characterized as early and possibly involved with tumor initiation, or late and therefore playing a growth support role or merely being a consequence of diverse signaling pathway activation, after the malignant transformation (Schneider et al., 1987; Brandstetter et al., 1998; Kato et al., 1999; Tice et al., 2002). Both early and late changes may have significant biological or medical roles, either by participating in the tumorigenesis or by serving as tumor markers that can help classify tumors or sort them into prognostic groups (Jen et al., 1994; Telang et al., 1998; Isfort et al., 1999). Identifying differential expression patterns has shifted from being a major scientific undertaking into becoming a relatively simple and high throughput process, after which investigators are often left with more data than they can actually interpret (van den Berg et al., 1989; Tai et al., 1998; Velculescu et al., 2000; Coller et al., 2000). We recently used two independent methodologies to identify oncogene-induced expression changes (Louro et al., 2002). The suppression subtractive hybridization (SSH) technique is a PCR-based process in which only messages present in the tested population, but not in the driver population, are exponentially amplified (Diatchenko et al., 1996). The Affymetrix microarray technology utilizes a DNA chip in which surface DNA oligos (25 mers) are synthesized, representing approximately 8800 genes per microarray (U34 rat genome arrays). Therefore, with the utilization of U34A and U34B microarrays, more than 17,000 transcripts were tested for differential expression. Both methodologies have proven useful and complementary, since no single technique was able to detect all the differences that were identified (Louro et al., 2002). Moreover, it is questionable whether expression patterns observed in tissue culture cell lines can be extrapolated into the in vivo human context (Wu and Chikaraishi, 1990; Kees et al., 1992; Mackay et al., 1992; Roland and Morello, 1993; Lee and Maihle, 1998). Acquiring good quality and interpretable data from human specimens is often a challenging task, due to genetic background variability from one human subject to another. In addition, the cellular microenvironment is far from 100% controllable; samples are frequently exposed to below-optimal temperature conditions between collection and utilization, and the availability of specimens may not be sufficient to provide statistically significant data. When all variables are taken together, one can see that a cell line is needed that serves as a good model for malignant transformation, with an identical genetic background, under controllable culturing conditions, with unlimited sample availability and which would portray biological events in an in vivo setting. Based on these criteria, we decided to use RK3E cells, a diploid cell line, immortalized after the transfection of adenoviral-E1A into baby rat kidney cells (Louro et al., 1999). The resulting line grows as a monolayer and has the ability to be transformed by multiple oncogenes (i.e., GLI, MYC, RAS, and GKLF), after which transformed cells lose contact inhibition and grow in a tumor fashion, piling up on the top of each other. These so-called foci can be macroscopically visualized and scored, enabling the investigator to study signals that affect malignant transformation. Foci can also be isolated and expanded as RK3E-derived malignant cell lines. In previous studies, we have demonstrated that oncogene-induced expression changes in RK3E cells actually portray changes induced by the same oncogene in human tumors (Louro et al., 2002). This correlation was demonstrated by in situ hybridization (ISH) analysis of human tumors that were known to express GLI. Non-radioactive ISH probes were generated to detect the presence of GLI-induced transcripts, and several selected human tumors were tested. Virtually all of the designed probes showed expression in the tumor mass, except for one transcript that showed a pattern of expression around the tumor and is therefore believed to be induced by GLI in a paracrine fashion. We attempted to identify the time frame of oncogene-target inductions, as well as the specificity of induced messages. These analyses enabled us to determine if induced transcription is an early or a late event, as well as specific to a single oncogene, or is shared by more than one oncogene. The biological implications of such categorization are extensive and point towards genes that may be involved early in the malignant transformation of tumors, or late, possibly resulting from a cascade of events subsequent to the malignant start point. MATERIAL AND METHODS Suppression subtractive hybridization The SSH technique was developed, patented, and commercialized by Clontech, under the name Clontech PCR-SelectTM cDNA Subtraction Kit (cat # K1804-1). We have extensively modified the procedure described in the user’s manual to achieve maximal subtraction of common messages and enrichment of differentially expressed mRNA transcripts. Most of all, this procedure requires that high quality poly A+ RNA is produced, from which cDNA is synthesized. The alterations of the manufacturer’s protocol were as described below. Linkers and primers provided in the kit were substituted with others, based on Diatchenko et al. (1996). To produce cDNA from poly A+ RNA, we substituted the avian reverse transcriptase in the Clontech Kit with murine reverse transcriptase, sold by Invitrogen in the ZAP cDNA Synthesis Kit. The enzyme, as well as the conditions used in the Invitrogen Kit, have consistently given us higher cDNA yields, as well as longer molecules; however, the methylated dCTP was substituted for regular dCTP, as the methylated species seem to be considerably less restricted by RSA I. The first hybridization was performed in a 3-µl volume, instead of 4 µl, for 24 h, at which time point 1 µl of fresh denatured driver in 1X hybridization buffer was added, and hybridization was continued for another 24 h. The second hybridization, after the two tester populations were mixed together, was allowed to proceed for 48 h, and no more driver was added. At the end of the primary and secondary hybridizations, a titration of the library was performed, by making serial 1:10 dilutions of the final product, until no PCR product was detected on 2% agarose gels. By scoring the number of distinct visible bands per lane and multiplying by the dilution factor, we were able to estimate the titration of the library and also have a crude estimate of the library complexity. In order to clone SSH products, we used the Zero Background/Kan Cloning Kit (Invitrogen). Cloned SSH products were sequenced (Iowa State University sequencing facility) and blasted online for sequence homology. Selected sequences were tested in Northern blots to confirm SSH subtraction results. Total RNA and poly A+ RNA isolation Total RNA was isolated as described by Chomczynski and Sacchi (1987). The entire procedure was repeated, using the eluted mRNA (double-pass poly A+ RNA) to minimize contamination with ribosomal RNA. At the end of the protocol, the mRNA was precipitated using 1/10 volume of 2 M KOAc, pH 5.0, and 2.5 volumes of 100% ethanol. After overnight incubation at -70°C, the precipitate was microcentrifuged for 30 min at 4°C, washed once in 70% ethanol, and resuspended in appropriate volumes of DEPC-treated water. Northern blots RNA was denatured, separated on a 1.5% formaldehyde agarose gel, and transferred to a nitrocellulose membrane (Schleicher & Shuell). Prehybridization was at 42°C for 3 h in 50% formamide, 4X SSC, 0.1 M sodium phosphate, pH 6.8, 0.1% sodium pyrophosphate, 0.1% SDS, 5X Denhardt’s, and 25 mg/ml denatured salmon sperm DNA. The blot was hybridized to labeled probe at 42°C for 16-20 h. The hybridization mixture contained 45% formamide, 4X SSC, 0.1 M sodium phosphate, pH 6.8, 0.075% sodium pyrophosphate, 0.1% SDS, 10% dextran sulfate, and 100 µg/ml denatured salmon sperm DNA. The filter was washed twice in 2X SSC, 0.1% SDS for 20 min at room temperature, then in 0.3X SSC, 0.3% SDS for 30 min at 59°C for cross-species hybridizations or at 65°C for same-species hybridizations, and then exposed to film. Cell transfection by high-titer retroviral supernatants Retroviral supernatants were used to infect RK3E cells. This procedure consists of cloning the gene of interest into a retroviral-based vector and transfecting the construct into a 293-derived ecotropic packaging cell line that produces high-titer retroviral supernatants, which can then be used for infection of other cell lines. This method has the advantages that high efficiency of transfection is achieved by the retrovirus, and almost 100% of the transfected cells integrate the gene of interest. Nucleotide sequencing Automated dideoxy sequencing (Sanger et al., 1977) was performed at the Iowa State University DNA Sequencing and Synthesis Facility. For the reactions, we used the Applied Biosytems (Foster City, CA, USA) Prism BigDye terminator cycle sequencing kit with AmpliTaq DNA polymerase, FS Taq polymerase and these were electrophoresed on an Applied Biosystems Prism 377 DNA sequencer. Densitometry To calculate the pixel density of specific bands, after completion of the Northern blot procedure, the developed X-ray film was scanned and imported into Imagequant Software (Amersham Biosciences, Sunnyvale, CA, USA). The same procedure was applied to the loading control, so that relative loading values could be calculated. Normalization was achieved by dividing the Northern blot quantified band by its respective loading control value. Normalized data were then plotted using a Microsoft Excel spreadsheet (Microsoft Office 2000). RESULTS Oncogene-induced targets isolated from established cell lines represent late transcriptional events In order to characterize the timeframe of oncogene-induced transcriptional activation, we used results from the SSH methodology to investigate how early the isolated transcripts could be detected. The investigation was performed using high-titer retroviral transfections to introduce GLI into RK3E cells. The efficiency of such transfections is close to 100%, and the majority of the cells are able to receive and express the GLI-containing retroviral vector as soon as 24 h after transfection. By selecting cells in G418 for 3 to 10 days, at which time point RNA was extracted, we were able to determine how early after oncogene transfection identified target messages were induced. We previously validated the induction timeframe by showing that a known direct target of GLI (patched) is induced at the 3- and 10-day time points (Louro et al., 2002). Moreover, by using an inducible GLI construct we also found that direct targets, such as patched, are identifiable as soon as 1 h after oncogene translocation into the cell nucleus. Although direct targets are rapidly induced by oncogene activation, we found that most expression changes observed in established cell lines are part of late transcriptional events and do not occur within the first 10 days after oncogene transfection (Figures 1, 2 and 3). These results are indicative that most oncogene direct targets are transiently induced, shortly after oncogenic transformation, and they subsequently decrease their expression levels again, making it technically difficult to isolate direct targets from established cell lines. Based on Northern blot analysis, we found that s7 (ribosomal protein), mad3, pp2a, and rig are upregulated in one or more GLI cell lines (mad3 is upregulated in GLI-A and GLI-RR1 cells, whereas s7 is only upregulated in the GLI-A cell line; see Figure 1).
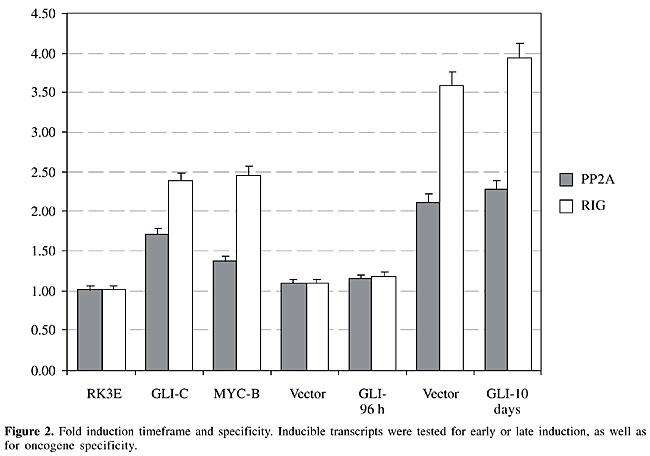
Vector-induced gene expression We also found that some transcriptional patterns are elicited by the oncogene-bearing vector and not by the oncogene itself. In our experiments, vector-attributed changes were not apparent at the 3-day time point, but they became obvious 10 days after transfection (Figures 1 and 2; pp2a and rig). Mad3 showed a transient increase in transcription at day 3, attributed to the viral vector backbone, which disappeared after 10 days, and came back later in the established cell line (Figures 1 and 3). In contrast, s7 started as a moderately expressed message in RK3E cells, was induced in the GLI-A cell line, and also appeared to be upregulated early by the viral vector backbone (Figures 1 and 3).
Fold-induction variation To calculate the relative fold induction for each target transcript, we scanned the developed X-ray film after the Northern blot procedure, and used the Molecular Dynamics ImageQuant software (Amersham Biosciences) to determine pixel density of selected bands. The same procedure was applied to the ethidium bromide-stained gels (not shown in the figures), to determine the relative RNA loading of each lane. This procedure allowed for the normalization of all bands, and a fold change was attributed to each sample. Fold inductions were variable, as expected, and the highest rate of induction (mad3, Figure 3) correlated with the lowest baseline expression, since the closer to zero the baseline is, the higher and the more evident is the calculated transcriptional induction. All other targets, pp2a, s7 and rig, showed modest inductions, ranging from 1.5 to 2.5, and as shown in Figures 2 and 3, these transcriptional changes were obvious in the cell lines, but not early after oncogene transfection.
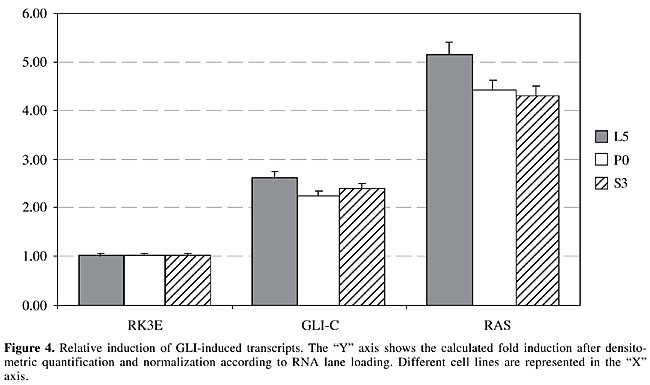
Oncogene-specificity of GLI transcriptional changes In an attempt to determine if GLI-induced transcripts are also induced by other oncogenes, we divided induced messages into two distinct groups, one that demonstrates a clear specificity for GLI and therefore is not induced by other oncogenes, such as MYC or RAS, and a second group that appears to be common to more than one oncogene. The category of GLI-specific targets was indicated by mad3 (Figure 3), since it is not induced by other oncogenes. In contrast, l5, p0, s3, pp2a, rig, and s7 are also induced by either RAS or MYC and therefore fall into the second category. Interestingly, l5, p0 and s3 show an even higher transcriptional activation by RAS than they do by GLI (Figure 4), whereas pp2a and s7 are more induced by GLI than by other oncogenes (Figures 2 and 3), and finally, rig had approximately the same level of activation by GLI and MYC (Figure 2).
DISCUSSION It is currently a common approach in cancer research to study the differences between normal and malignant tissues, in order to determine the transcriptional alterations caused by the tumorigenic process, and thereby infer the oncoprotein networks playing a role in cellular transformation (Field et al., 1989; Williams and Wynford-Thomas, 1989; Oliner et al., 1993; Ohtani et al., 1998; Vonlanthen et al., 2001; Westerheide et al., 2001). However, it is quite challenging to study transcriptional changes in vivo, since they are part of a complex system, in which many interactions or events are uncontrollable by the investigator. For instance, every patient carries a different genetic background, which will greatly influence how tumors arise, progress and respond to therapy. By the same token, different people have diverse habits, eat specific foods, live in determined environments, and all those factors will ultimately influence results obtained from direct analysis of tumor samples. Therefore, when dealing with a great number of variables, the investigator needs to be careful when making interpretations and drawing conclusions, which, nonetheless, may be very important for the growing knowledge about cancer and its dynamic context. Clinical trials, for instance, take into account all of the aforementioned difficulties, and also require strong statistical support in order to reach conclusions that can be, in turn, applied back to how patients are managed, in terms of disease detection, therapy and follow-up. In trying to understand the biology of cancer, it is common to analyze changes that occur in a well-controlled microenvironment, and to extrapolate those results into the broader macroenvironment scenario. This too offers challenges, since the events resulting from careful manipulation of cells in culture will not always mimic what happens in the context of a human being, for the same reasons stated above. Therefore, we have to choose the best methods for our studies and take into consideration their strengths and weaknesses. Because established cell lines are frequently used in the laboratorial analysis of tumor biology, we have questioned whether transcriptional alterations observed in cultured cells are actually predictive of alterations that occur early on during transformation. We found that most messages identified as upregulated in cell lines result from transcriptional changes occurring more than one step downstream of the oncogene transcription factor. It is hard to evaluate which category of message is more important for cancer development, early or late, and it seems logical that these two types play different and important roles during the malignant process. However, cancer investigators need to be aware that, when using cell lines to address specific questions about tumor behavior, such as transcriptional patterns, they are most likely visualizing pattern shifts that occur after these cells have been growing in vitro for a length of time, during which many cell divisions have occurred, multiple adaptation processes to the in vitro culture environment have taken place, and these cells may not necessary respond to specific conditions, as they would have originally in the tumors where they were isolated from. Some cell lines are notorious for their use in the research laboratory, such as NIH/3T3 cells, which have currently been cited in more than 5,000 indexed manuscripts, giving us a perspective of the importance of the characterization of cell line behavior. In general, cells need to grow for long periods of time in culture and will progressively become less representative of in vivo tumor behavior. However, it must be emphasized that cell lines can certainly lead investigators to very elucidating conclusions about in vivo events, as long as we observe strict criteria during the analysis of cell line data (Pons et al., 1998; Rajala et al., 2000; Hirsch et al., 2002; Lee et al., 2002; Vecsey-Semjen et al., 2002). ACKNOWLEDGMENTS We acknowledge the financial support provided by CNPq and FACITEC. B.M.V. Azevedo and B.A. Vianna were recipients of FACITEC and CNPq fellowships, respectively. REFERENCES Brandstetter, T., Ninci, E., Falken, U., Wagner, E., Hess, R. and Bauknecht, T. (1998). rhG-CSF affects genes involved in mitogen signaling and early gene expression in the ovarian cancer cell line HEY. Int. J. Cancer 75: 847-854. Chomczynski, P. and Sacchi, N. (1987). Single-step method of RNA isolation by acid guanidinium thiocyanate-phenol-chloroform extraction. Anal. Biochem. 162: 156-159. Coller, H.A., Grandori, C., Tamayo, P., Colbert, T., Lander, E.S., Eisenman, R.N. and Golub, T.R. (2000). Expression analysis with oligonucleotide microarrays reveals that MYC regulates genes involved in growth, cell cycle, signaling, and adhesion. Proc. Natl. Acad. Sci. USA 97: 3260-3265. Diatchenko, L., Lau, Y.F., Campbell, A.P., Chenchik, A., Moqadam, F., Huang, B., Lukyanov, S., Lukyanov, K., Gurskaya, N., Sverdlov, E.D. and Siebert, P.D. (1996). Suppression subtractive hybridization: a method for generating differentially regulated or tissue-specific cDNA probes and libraries. Proc. Natl. Acad. Sci. USA 93: 6025-6030. Field, J.K., Spandidos, D.A., Stell, P.M., Vaughan, E.D., Evan, G.I. and Moore, J.P. (1989). Elevated expression of the c-myc oncoprotein correlates with poor prognosis in head and neck squamous cell carcinoma. Oncogene 4: 1463-1468. Hirsch, F.R., Helfrich, B., Franklin, W.A., Varella-Garcia, M., Chan, D.C. and Bunn Jr., P.A. (2002). Preclinical studies of gemcitabine and trastuzumab in breast and lung cancer cell lines. Clin. Breast Cancer 3 (Suppl 1): 12-16. Isfort, R.J., Cody, D.B., Lovell, G.J., Gioeli, D., Weissman, B.E. and Doersen, C.J. (1999). Analysis of oncogene, tumor suppressor gene, and chromosomal alterations in HeLa x osteosarcoma somatic cell hybrids. Mol. Carcinog. 25: 30-41. Jen, J., Kim, H., Piantadosi, S., Liu, Z.F., Levitt, R.C., Sistonen, P., Kinzler, K.W., Vogelstein, B. and Hamilton, S.R. (1994). Allelic loss of chromosome 18q and prognosis in colorectal cancer. N. Engl. J. Med. 331: 213-221. Kato, M., Liu, W., Akhand, A.A., Dai, Y., Ohbayashi, M., Tuzuki, T., Suzuki, H., Isobe, K.I., Takahashi, M. and Nakashima, I. (1999). Linkage between melanocytic tumor development and early burst of Ret protein expression for tolerance induction in metallothionein-I/ret transgenic mouse lines. Oncogene 18: 837-842. Kees, U.R., Rudduck, C., Ford, J., Spagnolo, D., Papadimitriou, J., Willoughby, M.L. and Garson, O.M. (1992). Two malignant peripheral primitive neuroepithelial tumor cell lines established from consecutive samples of one patient: characterization and cytogenetic analysis. Genes Chromosomes Cancer 4: 195-204. Lee, G., Kim, Y.B., Kim, J.H., Kim, M.S., Shin, K.H., Won, Y.S., Lee, J.I., Choung, P.H., Hyun, P.H. and Min, B.M. (2002). Characterization of novel cell lines established from three human oral squamous cell carcinomas. Int. J. Oncol. 20: 1151-1159. Lee, H. and Maihle, N.J. (1998). Isolation and characterization of four alternate c-erbB3 transcripts expressed in ovarian carcinoma-derived cell lines and normal human tissues. Oncogene 16: 3243-3252. Louro, I.D., McKie-Bell, P., Gosnell, H., Brindley, B.C., Bucy, R.P. and Ruppert, J.M. (1999). The zinc finger protein GLI induces cellular sensitivity to the mTOR inhibitor rapamycin. Cell Growth Differ. 10: 503-516. Louro, I.D., Bailey, E.C., Li X., South, L.S., McKie-Bell, P.R., Yoder, B.K., Huang, C.C., Johnson, M.R., Hill, A.E., Johnson, R.L. and Ruppert, J.M. (2002). Comparative gene expression profile analysis of GLI and c-MYC in an epithelial model of malignant transformation. Cancer Res 62: 5867-5873. Mackay, A.R., Ballin, M., Pelina, M.D., Farina, A.R., Nason, A.M., Hartzler, J.L. and Thorgeirrson, U.P. (1992). Effect of phorbol ester and cytokines on matrix metalloproteinase and tissue inhibitor of metalloproteinase expression in tumor and normal cell lines. Invasion Metastasis 12: 168-184. Ohtani, K., Tsujimoto, A., Tsukahara, T., Numata, N., Miura, S., Sugamura, K. and Nakamura, M. (1998). Molecular mechanisms of promoter regulation of the gp34 gene that is trans-activated by an oncoprotein Tax of human T cell leukemia virus type I. J. Biol. Chem. 273: 14119-14129. Oliner, J.D., Pietenpol, J.A., Thiagalingam, S., Gyuris, J., Kinzler, K.W. and Vogelstein, B. (1993). Oncoprotein MDM2 conceals the activation domain of tumour suppressor p53. Nature 362: 857-860. Pons, E., Uphoff, C.C. and Drexler, H.G. (1998). Expression of hepatocyte growth factor and its receptor c-met in human leukemia-lymphoma cell lines. Leuk. Res. 22: 797-804. Rajala, R.V., Dehm, S., Bi, X., Bonham, K. and Sharma, R.K. (2000). Expression of N-myristoyltransferase inhibitor protein and its relationship to c-Src levels in human colon cancer cell lines. Biochem. Biophys. Res. Commun. 273: 1116-1120. Roland, J. and Morello, D. (1993). H-2/myc, E mu/myc, and c-myc transgenic mice: potent sources of early hematopoietic cell lines. Cell Growth Differ. 4: 891-900. Sanger, F., Nicklen, S. and Coulson, A.R. (1977). DNA sequencing with chain-terminating inhibitors. Proc. Natl. Acad. Sci. USA 74: 5463-5467. Schneider, J.F., Fisher, F., Goding, C.R. and Jones, N.C. (1987). Mutational analysis of the adenovirus E1a gene: the role of transcriptional regulation in transformation. EMBO J. 6: 2053-2060. Tai, Y.T., Lee, S., Niloff, E., Weisman, C., Strobel, T. and Cannistra, S.A. (1998). BAX protein expression and clinical outcome in epithelial ovarian cancer. J. Clin. Oncol. 16: 2583-2590. Telang, N.T., Arcuri, F., Granata, O.M., Bradlow, H.L., Osborne, M.P. and Castagnetta L. (1998). Alteration of oestradiol metabolism in myc oncogene-transfected mouse mammary epithelial cells. Br. J. Cancer 77: 1549-1554. Tice, D.A., Soloviev, I. and Polakis, P. (2002). Activation of the Wnt pathway interferes with serum response element-driven transcription of immediate early genes. J. Biol. Chem. 277: 6118-6123. van den Berg, F.M., Tigges, A.J., Schipper, M.E., Hartog-Jager, F.C., Kroes, W.G. and Walboomers, J.M. (1989). Expression of the nuclear oncogene p53 in colon tumors. J. Pathol. 157: 193-199. Vecsey-Semjen, B., Becker, K.F., Sinski, A., Blennow, E., Vietor, I., Zatloukal, K., Beug, H., Wagner, E. and Huber, L.A. (2002). Novel colon cancer cell lines leading to better understanding of the diversity of respective primary cancers. Oncogene 21: 4646-4662. Velculescu, V.E., Vogelstein, B. and Kinzler, K.W. (2000). Analyzing uncharted transcriptomes with SAGE. Trends Genet. 16: 423-425. Vonlanthen, S., Heighway, J., Altermatt, H.J., Gugger, M., Kappeler, A., Borner, M.M., van Lohuizen, M. and Betticher, D.C. (2001). The bmi-1 oncoprotein is differentially expressed in non-small cell lung cancer and correlates with INK4A-ARF locus expression. Br. J. Cancer 84: 1372-1376. Westerheide, S.D., Mayo, M.W., Anest, V., Hanson, J.L. and Baldwin Jr., A.S. (2001). The putative oncoprotein Bcl-3 induces cyclin D1 to stimulate G (1) transition. Mol. Cell Biol. 21: 8428-8436. Williams, N.W. and Wynford-Thomas, D. (1989). Oncoprotein p53 expression in normal, immortalized, and transformed mouse fibroblasts. Exp. Cell Res. 184: 316-328. Wu, J.K. and Chikaraishi, D.M. (1990). Differential expression of ros oncogene in primary human astrocytomas and astrocytoma cell lines. Cancer Res. 50: 3032-3035. |
|