
![]()
![]()
![]()
![]()
![]()
![]()
![]()
![]()
![]()
![]()
![]()
ABSTRACT. A new tool called System for Automated Bacterial Integrated Annotation - SABIA (SABIÁ being a very well-known bird in Brazil) was developed for the assembly and annotation of bacterial genomes. This system performs automatic tasks of assembly analysis, ORFs identification/analysis, and extragenic region analyses. Genome assembly and contig automatic annotation data are also available in the same working environment. The system integrates several public domains and newly developed software programs capable of dealing with several types of databases, and it is portable to other operational systems. These programs interact with most of the well-known biological database/softwares, such as Glimmer, Genemark, the BLAST family programs, InterPro, COG, Kegg, PSORT, GO, tRNAScan and RBSFinder, and can also be used to identify metabolic pathways. Key words: Assembly, Automatic annotation, Software INTRODUCTION The SABIA (System for Automated Bacterial Integrated Annotation) software was developed to fulfill the computer needs of the Brazilian Genome Project for the management, assembly and annotation of the Chromobacterium violaceum genome. Its purpose was to integrate and automate the use of programs, and to facilitate access to public domain database, as well as those developed locally by the Bioinformatics Laboratory (LABINFO/LNCC) team. One of the particular features of this project was that the general coordination, the DNA laboratories, and the bioinformatics and sequencing laboratories were geographically distant from one another, being distributed throughout much of Brazil (for information on the origin and significance of the network, see Simpson, 2001). In order to deal with the drawbacks inherent to projects of this type, a series of follow-up and management reports were made available daily on the project’s home page (www.brgene.lncc.br/cviolaceum). Tables containing information, such as the quality of the sequences submitted by each group, libraries and plates, among others, allowed decisions to be made and strategies to be established during the project’s development. The initial strategy to assemble the genome was large-scale sequencing of shotgun reads (Fleischmann et al., 1995) and cosmid ends. The contigs that were generated were ordered through a scaffold program (Setubal and Werneck, 2001). Following this phase the gap closure, or the finishing of the genome sequence generated by the shotgun sequences, was initiated. Two basic gap types were identified: i) sequence or sequencing gaps, in which there is a DNA template (cosmid or shotgun read) with extremities in two adjacent contigs, and ii) physical gaps, for which there is no binding DNA template. The existence of the gaps could be explained by statistical or by functional and methodological reasons, as for instance, unstable regions or non-cloning toxic sequences, or a cloning bias associated with either the DNA fragmentation method or the cloning system used. Gaps are frequently associated with repetitive regions, such as the ribosomal operons, transposases and large genetic families. The sequencing gaps are easily closed after a careful selection of the shotgun clones for re-sequencing and subcloning. As for the physical gaps and the repetitive regions, specific closure methodologies were developed that are described elsewhere (Carraro et al., 2003). As the gaps were closed, the number of contigs decreased, the assembly was frozen, and annotation could be initiated. The SABIA method relies on the metabolic pathways of the organism; this is an approach distinct from those generally used by other genome projects, for it allows the premature identification of regions of particular interest. This system uses a group of well-known software and database, such as Glimmer (Delcher et al., 1999), GeneMark (Borodovsky and McIninch, 1993), tRNAscan (Lowe and Eddy, 1997), Blast (Altschul et al., 1990), InterPro (Mulder et al., 2003), KEGG (Kanehisa, 1996), and COG (Tatusov et al., 1997). Software description SABIA is made of two defined modules: assembly and annotation. Each module consists of a group of softwares written in the PERL programming language (version 5.6), executed in a command line fashion, or under the http Apache manager (version 1.3), and a relational database, implemented by means of MySQL software (version 1.3). The SABIA version used in this project was installed under the UNIX operating system. The annotation module requires the database nt, nr (www.ncbi.nlm.nih.gov), COG, KEGG, InterPro and GO (http://geneontology.org/) for proper functioning. The two modules are interconnected, thus allowing genomic sequences generated during the assembly phase to be used during annotation; likewise the information generated by the annotation can assist in the process of assembly analysis. The automatic assembly and annotation processes can be configured to be executed periodically. AssemblyThe large volume of data and tasks involved in the analysis and assembly of the C. violaceum genome motivated the construction of the SABIA assembly module. This module coordinates the automation, integration and organization of the results generated by the phred/phrap/consed programs (www.phrap.org). The package accomplishes tasks ranging from chromatogram analysis to assembly visualization, creating files that contain the assembly results to be used by SABIA. SABIA provides follow-up reports and supporting tools for the administration of the project, sequencing analyses and assembly of the genomes. The sequencing of the C. violaceum genome was divided into three phases: i) sequencing of the shotgun reads: approximately 80,000 reads with phred scores >20 were generated from both ends of plasmid clones ranging from 2.0 to 4.0 kb, providing a 13-fold genome coverage; ii) sequencing of the cosmid ends: both ends of 3,350 cosmid clones with an average insert size of 40 kb were also sequenced, thus providing a validation check of the final assembly, and iii) the finishing phase, where the quality of the assembled sequences was analyzed. Submission of shotgun reads SABIA manages the process of read submission and analyses by providing reports of read production (both quality and quantity), which help in the identification of the shotgun phase finalization. The submission process and the “nomination” of shotgun reads was standardized and established by a protocol that takes into account the name of the organism, the laboratory, the library, the plate and the orientation (the sequenced end in the forward direction is identified by the letter “b” and the sequenced end in the reverse direction by the letter “g”). For submission, the user informs a contact e-mail, the plate identification, the sequence orientation (b or g), and attaches the zipped file with the reads (Figure 1). After unzipping the file, the reads are nominated according to the previously determined pattern, and the information provided during submission. Whenever there are reads with the same name, or the name does not agree with the pattern, the read is rejected and the user notified. The phred (base calling) program is then executed; it checks for vector sequences that will be replaced by “X”, in order to avoid their usage during assembly. SABIA then analyzes the file, calculating the size of each sequence, the number of bases with phred quality ³20 and ³30, the number of bases corresponding to vectors (total, ³20 and ³30). The result of this analysis is sent by e-mail to the project coordinators and to the laboratory submitting the file. These data are important to evaluate the quality of each file, the production of each laboratory and of the sequencing net, as well as the quality of the library that was used. The accounting data are stored at the assembly database, and updated reports are made available on the web. 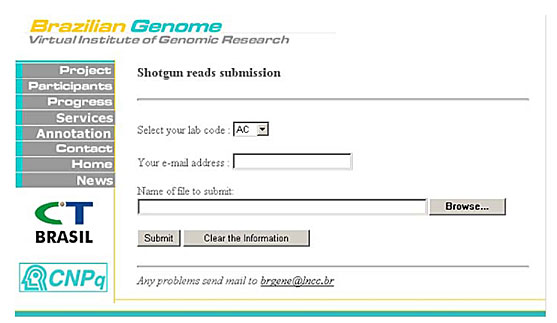
Figure 1. Sequence submission page.
Only reads containing 400 bases with phred quality ³20 were considered for the sequencing of the C. violaceum genome. Two types of reports were created (Figure 2), one with the total and monthly production of each laboratory, the other with the total production and the production of each laboratory or library. A follow-up of the total production could also be made through the monthly graphic reports. 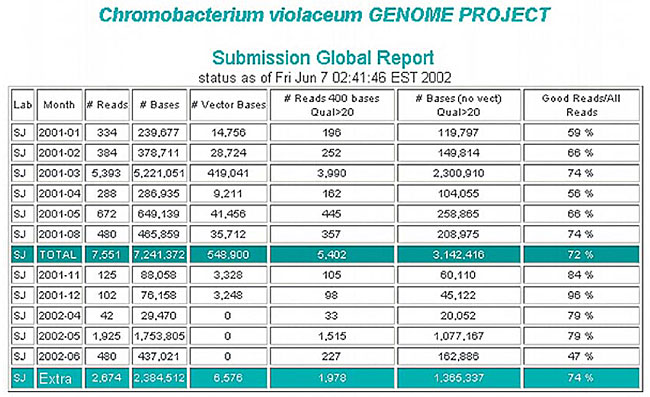
Figure 2. Report of read production from a lab, showing the number of reads and bases, and the read qualities.
An important additional report is the “assembly report for shotgun library”, which provides a synthesis of the quality of the genome libraries built for the project. It includes some relevant information, such as the percentage of vector sequences and the average size of the clones, updated daily (Figure 3). 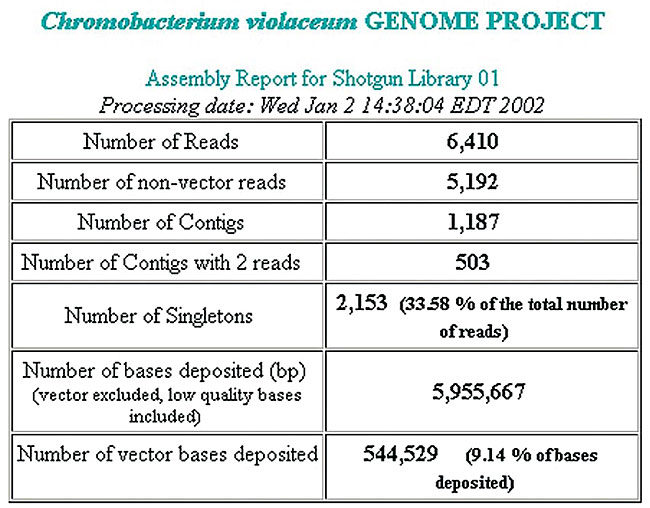
Figure 3. Report of a library, showing the number of sequenced reads, the contigs and singlets formed.
Assembly execution To assemble the genome, SABIA automatically runs the phredphrap program and stores the results in the database for subsequent analysis. The execution of some tasks, such as creation of the repetition file, formatting the reads and contig sequence banks in the blast format, generation of the scaffold map, freezing of the assembly, and analysis of the repetitions are automatic, and may be executed when ordered by the administrator. Assembly follow-up To allow the monitoring of the genome assembly evolution, the phrap.out file is analyzed by SABIA and various types of data are transferred to the database. This follow-up can be made by means of graphic reports (Figure 4), or through text reports carrying information such as: total number of reads submitted with or without vectors, total number of bases with desired quality, number of singlets, singletons and contigs, number of reads used to assemble the contigs, distribution of the contigs according to the number of reads, among others (Figures 5, 6 and 7). These data, associated with the graphic reports, enable a vision of the assembly progress, indicating the end of large-scale sequencing and the beginning of genome finalization. 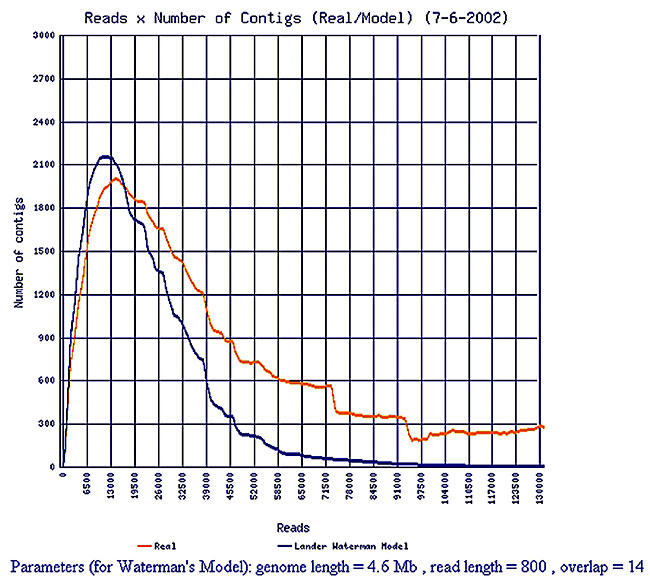
Figure 4. Evolution of contig number.
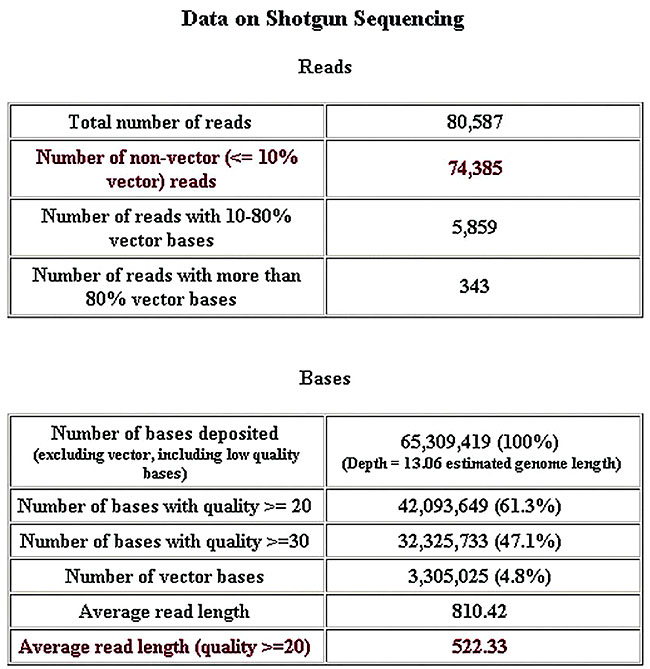
Figure 5. General assemblies report.
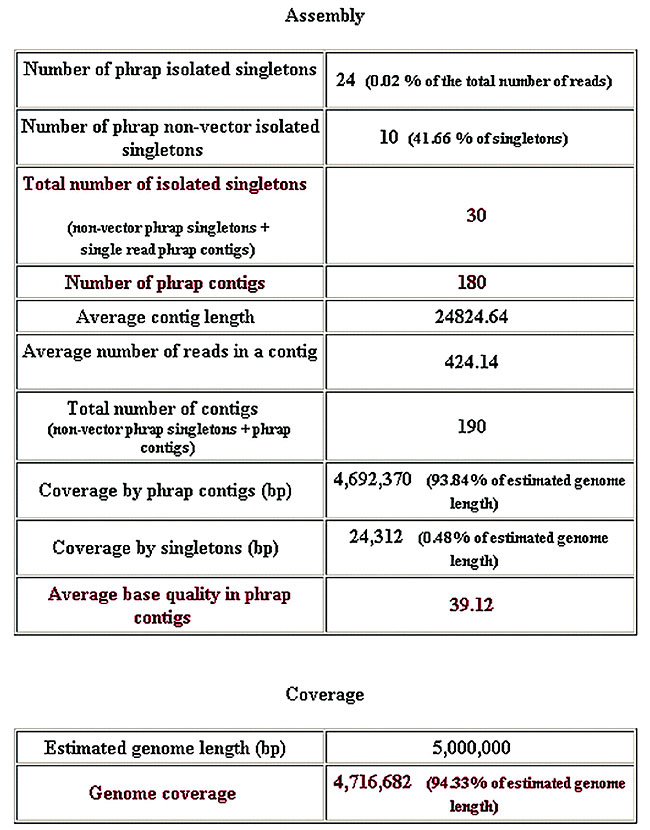
Figure 6. General assemblies report.
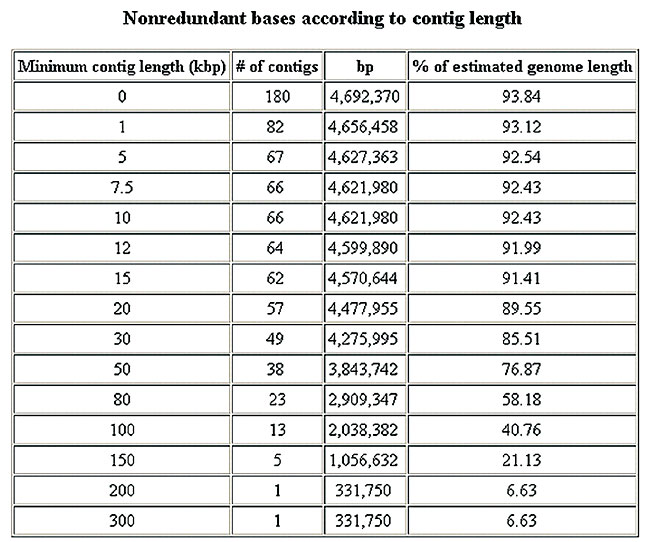
Figure 7. General assemblies report.
Repetitions Repetitive regions in the genome can cause serious assembly problems, and therefore they should be filtered and analyzed separately. These regions can be identified by the occurrence of reads in a quantity far superior to the average of the rest of the genome, the existence of an elevated number of bases with HQD (high quality discrepancy), or the identification of repetitive regions, such as rRNA operons and transposases based on the search of sequence database (nr). SABIA runs these tasks automatically, searching for regions where the density of the reads is greater than the average density in the rest of the genome and executing the alignment of the assembly contigs. The result of this alignment is stored in the database, and a report with the significant alignments is made available on the web, to be analyzed and eventually selected for screening. Cosmids submission Libraries of cosmids, with an average size of 40.000 bp, allowed the confirmation of the contig assemblies, as well as the identification of the connections between them. At first only the cosmid’s ends were sequenced, but as probable gap-closings were identified, they were completely sequenced. The nomenclature of the cosmid reads followed a particular pattern in order to distinguish them from other assembly reads. The sequencing laboratories could submit the cosmids in two ways: by means of an ace file generated by the phrap (assembly), or by means of the read list. Both the reads and the assembly of the cosmids, as well as the analysis of their quality, were stored in the database. Scaffold analysis The scaffold program was used as soon as the contig number began to decrease and the cosmid ends were submitted. This program generates a map from the phrap.out data, with one or more contig chains, with corresponding ordering and orientation. This program also takes into account the phrap-estimated distance between the shotgun and cosmid read ends. This distance should be compatible with the estimated clone size of each library. In this way there is an indication of gaps between the contigs (virtual gaps) and those gaps that are not connected with other contigs (real gaps). As the output data of the scaffold program is loaded into the SABIA database, it becomes possible to access the list of clones covering the gap region (Figure 8). If a repetition filter has originated this gap, a list of the filtered read ends is shown. This information is useful for the genome closing process described below. 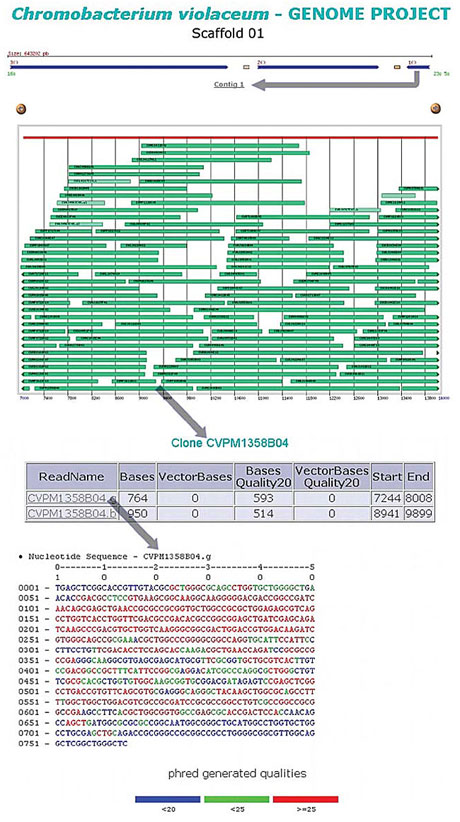
Figure 8. Scaffold’s map showing the contigs with the respective clones.
Genome closing The closing phase includes two stages: first, evaluation of the contig quality; second, the identification of the solution for closing existing gaps. The first stage consists of the identification of assembly problems, such as LCQ (low consensus quality): regions with phrap quality score below 25, and HQD (high quality discrepancy): high quality regions that differ from the consensus sequence and the NCBS (not confirmed both strands), since they do not show aligned reads in both orientations. The general assembly of the genome is then frozen (reference assembly) and the assembly manually executed for each contig. The related information is loaded into the database. After this stage, eventual problems are solved by the re-sequencing of shotgun read(s), by the specific primers drawings for the region, or by complete clone sequencing. This information is available to the sequencing groups in the project home page, which is updated in parallel with the reception of the respective submissions, provided the phrap quality is ³25 for all bases. At the second stage, two approaches are adopted: first, the automatic identification of the contig read ends that have not yet been submitted in both directions. This list is automatically generated and made available on the web. Second, the scaffold visualization tool is used to select the plasmid and cosmid clones that might close the gaps. For gaps generated by the repetition filters, the region is assembled by means of a read subgroup that is filtered until a sequence is found that can be anchored in both gap contigs, or else through the sequencing of cosmid or plasmid clones. Finally, with the help of consed, the frozen assembly with the ordered and closed gaps are converted to the FASTA format and transferred to the SABIA module. Automatic annotation The annotation module carries out the identification and functional categorization of all ORFs found in the genome (Figure 9). 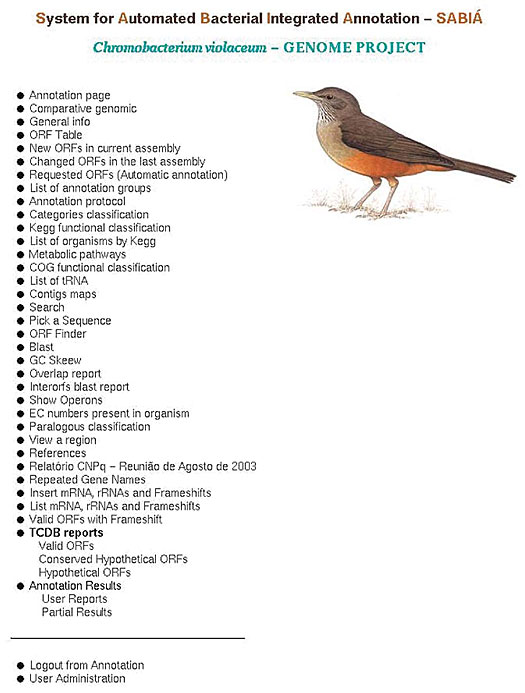
Figure 9. SABIA page showing all tools available.
ORFs identification The annotation process begins through the FASTA format contigs, with or without the respective qualities. The first annotation phase consists in an automatic search for ORFs and tRNAs. tRNAScan-SE was used for the tRNAs prediction. The programs used for ORF prediction were Glimmer, which uses Markov’s interpolated models, and GeneMark, which uses heuristic models. The annotation module allows only one of these programs to be used. These ORFs prediction programs must train their models with data from other organisms, preferably those situated phylogenetically close. Models extracted from E. coli were first used in this project, due to its well-known extensive annotation process; in a second phase, the ORFs of the genome itself were used. The RBSfinder program (www.tigr.org), which searches for ribosome-binding sites in the extragenic regions was also used, in order to increase the reliability of the Glimmer and GeneMark results. To accomplish this, the module that manages the ORFs identification filters the results, generating a single coordinate file, which is then used as the input of the RBSfinder program. ORF identification was performed automatically, taking into account the coordinates produced by the prediction programs and the output file of the RBS finder. After this procedure, information, such as the RBS position in the genome, new options for the initial codon, and the suggested shift for the RBS correction are stored in the database (Figure 10). 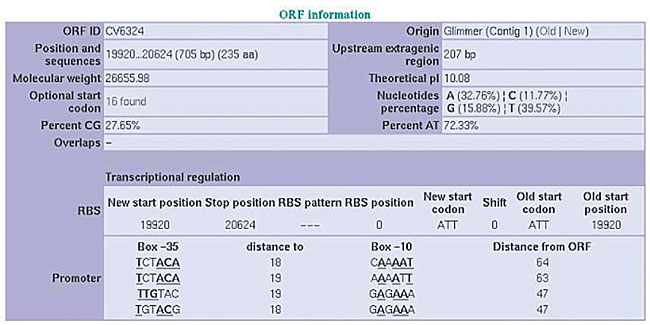
Figure 10. ORF’s data generated by the automatic annotation.
The next step is the identification of the extragenic regions for each of the ORFs, with the purpose of: i) looking for other possible initiation codons (optional start codons) in this region and in the 99 initial bases of each ORF; the purpose of this procedure is to reduce the overlaps between ORFs and to find the correct position of initiation codons; ii) looking for promoter boxes similar to the consensus sequence - 35 (TTGACA) and - 10 (TATAAT), with acceptance of up to three mismatches in each box and of 16 to 19 bp as the distance between them. Information about all the ORFs identified by the SABIA and stored in the database includes their nucleotide and protein sequences, associated with their phrap quality, as well as the nucleotide percentages, isoelectric points (IP) and molecular weights (MW). Also, using this module, genomic maps were generated, allowing the visualization of the ORF localizations. SABIA provides two types of maps, one showing all identified ORFs and another showing only the categorized ORFs. The size of each one of these maps may be configured to best suit the project’s needs, thereby allowing a group of annotators, for example, to have a particular map under its direct responsibility. The ORFs and other structures are represented by rectangles of different colors, and are functionally classified according to the KEGG or COG. An inscription describes each functional classification and its respective color in the maps. The height of the rectangles is proportional to the number of overlapping bases between two or more ORFs. All ORFs in the map are “clickable” and take the annotator to the annotation page of the corresponding ORF. If the browser allows the use of java script, by moving the mouse over an ORF the annotator obtains its functional description, and its start and end positions. Besides showing the distribution of and information about the ORFs, the maps allow the visualization of the tRNAs, mRNAs, rRNAs and frameshifts (Figures 11 and 12). 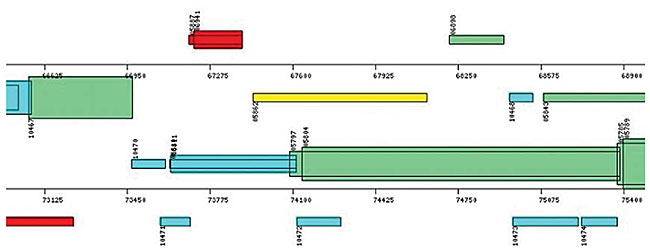
Figure 11. Map of a specific genome region showing the identified ORFs. Colors according to KEGG’s functional classification. Overlapped ORFs represented by large rectangles.
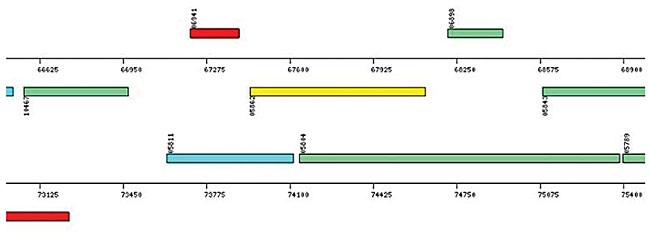
Figure 12. Map of a specific genome region showing the categorized ORFs.
Functional classification In the analysis of the nucleotide and amino acid sequences, SABIA manages the use of five programs of the Blast family: blastn, blastp, blastx, tblastn, and tblastx, which run through the server version (WWWBlastServer), allowing the alignment images to be generated, classified according to their scores, making the visualization of the results easier. An additional database was used in the C. violaceum project, dealing exclusively with pathogenic organism sequences. When the system accesses the base quality file, it automatically alters the final file, indicating the quality of each one of the bases in the alignment by means of a color pattern. In addition, the system automatically informs the score values, the expectation value (e-value), query coverage and subject coverage (Figures 13 and 14). 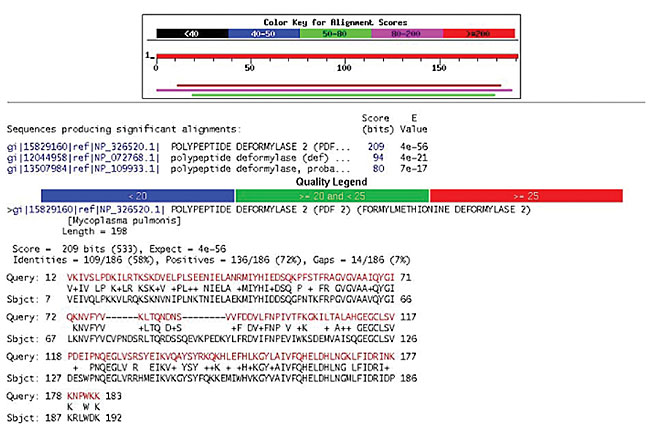
Figure 13. blastp result for an ORF.
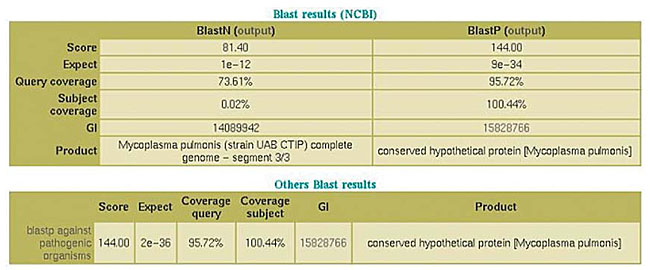
Figure 14. Results of blastn, blastp for NCBI database and blastp for pathogenic organism database.
The amino acid sequence is also used as an input for the PSORT (Nakai and Kanehisa, 1991) program, which predicts the location of the protein in the cell. ORFs classified by PSORT as membrane proteins are automatically aligned in relation to the sequence of the TCDB bank (Saier, 1999), by means of the BLASTP program. In this way it is possible to classify these proteins according to the information from this bank, and according to the already known transport protein number. The blastp and blastn programs are executed for each generated ORF, using the database of the KEGG (Kyoto Encyclopedia of Genes and Genomes), which contains more than 120 organisms. SABIA selects the best general result and also shows the results obtained for the E. coli genome. The information from these results, such as the organism, gene name (usually a four-letter annotation), synonyms, links to external sites (containing further data on the gene), metabolic pathways, unique functional classification, and EC number, is stored in the database (Figures 15 and 16). 
Figure 15. PSORT result.

Figure 16. TCDB result.
The amino acid sequence is used as an input for the local execution of InterPro. The information generated by this program is stored in the database: ID, Name, InterPro ID, InterPro name, GO, besides providing external links. The protein sequence of each ORF is used for local consultation in the COG database. Whenever the KEGG blast provides a result for an E. coli gene, it is used for the ORF functional classification, as recommended by Riley (1998). SABIA allows the insertion of new ORFs in the genome, by means of a tool denominated “pick a sequence”, which identifies six possible ORFs; these are graphically shown, in a given region of the genome, each with a link for the execution of a Blast program (Figure 17). Furthermore, SABIA allows structures, such as mRNAs, rRNAs and frameshifts, to be manually inserted. 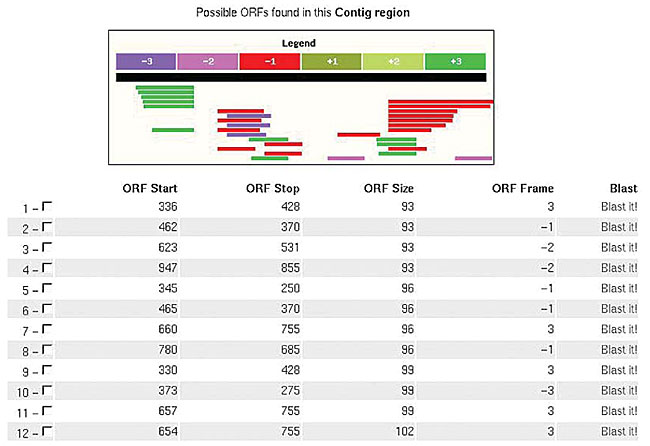
Figure 17. “Pick a Sequence” tool, showing all six possible frames.
The backup of all tables in the SABIA database can be scheduled for periodic execution (for C. violaceum, a daily schedule was adopted). All tables are stored in a single file. After “batch” processing, which performs the automatic annotation, the system loads all the information that is produced into the database. This information is available through a simple and intuitive web interface. Access to the web interface is limited to registered users authorized by the system administrator. There are three levels of access: i) the annotator, who may annotate and request new ORFs to the system; ii) the coordinator, who is able to end the annotation process for a specific group of ORFs; iii) the user, who is only allowed to examine the data and annotation through a web page (Figure 18). 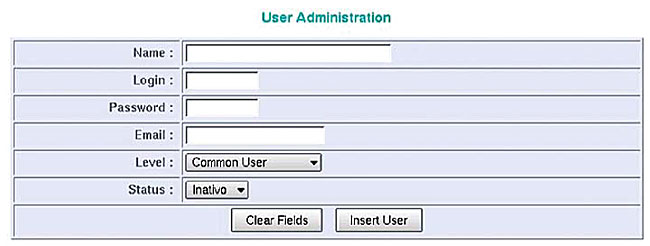
Figure 18. Screen of administrative user’s attributes.
In the earlier stages of the C. violaceum project, the annotator could visualize two graphs (Figure 19) on the web page, the first containing the genomic localization of the ORF and the second showing a summary of the information provided by the annotation module. Later on, two information blocks about the ORF were presented; the first had the ORF identification, the program used for its identification, its contig number, its position in the genome, the nucleotide and amino acid sequences, with their respective qualities, besides the information regarding the extragenic region: promoters, RBS and optional initiation codons, with links for the blastn or blastp programs. 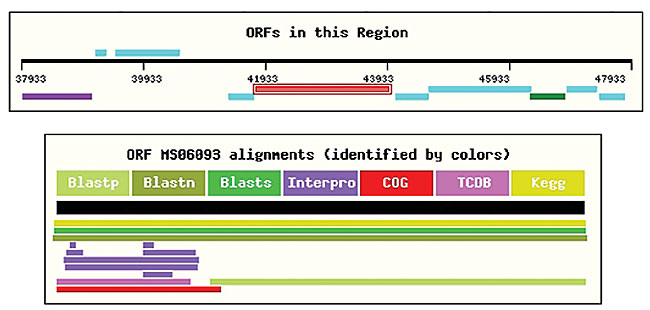
Figure 19. Several annotation illustrations.
The next block informed the best alignment derived from the blastn and blastp programs. Furthermore, information such as score, expectation value, query coverage, subject coverage, GI, and the product was available to the annotator. Finally the best results of the COG, KEGG and InterPro programs were shown. Annotator The annotation block is the part of the system where the annotator inserts the results of his final analysis, after evaluating all available information (Figure 20). The annotator is expected to insert the name of the gene, with eventual synonyms, EC number and primary and secondary categories. The annotator may describe useful details about the sequence under scrutiny in a notepad. This block permits access to the annotation report, where all the modifications can be visualized, as well as the time of annotation, the user’s name, and the product description. There is also an option of automatic annotation request to start optional initial codons and identified ORFs through the “pick a sequence” tool. 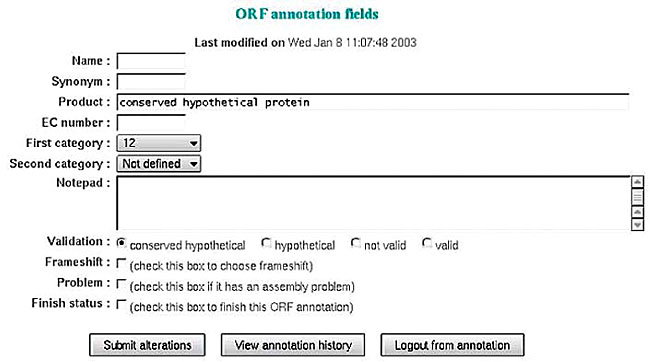
Figure 20. Screen for inserting annotation data.
The annotator classifies the ORF based on all the information generated by the automatic annotation. The following categories were adopted in the Brazilian genome project: - Valid ORF: whenever there was an extremely well-defined product. - Hypothetical conserved ORF: with similarities to other conserved ORFs or little similarity with valid ORFs in other organisms. - Hypothetical ORF: with no significant results in the Blast program. - Invalid ORF: i) with an overlap greater than 10 amino acids with other ORFs or ii) size below 50 amino acids. Additional functions include: - Submit alterations: new information provided by the user is kept in the database. - View annotation history: presents a page containing all previous annotations on the ORF. - Logout from annotation: to exit the annotation phase. - Optional first start: makes the ORF first start option available, selected during automatic annotation. Assembly updating The annotation module allows the update of the assembly already loaded in the bank, without losing existing information. The assembly update process is carried out safely and in a coordinated manner by a group of scripts. All new sequences are compared with the sequences downloaded in the database by using the Crossmatch program. The system will process three different situations: i) update the quantity of ORFs perfectly aligned with the ones found in the database; ii) accomplish automatic annotations for the new ORFs; iii) mark the ORFs that are no longer present in the new assembly or had some modification made in their base sequences. After the assembly updating process the system displays two reports through the web interface: a report of the ORFs found in the new version and a report of the ORFs that no longer exist. Verification of the ORFs in the extragenic region To determine whether all coding structures (ORFs, mRNAs, tRNAs) were identified, a group of scripts examines all the extragenic regions, with the help of the blastn and blastp programs, which search for such sequences. The process provides reports on the possible structures found and opens a link for the “pick a sequence” tool to be applied wherever needed. RESULTS AND DISCUSSION Some programs and report forms were developed to make the analysis of annotation easier, and also to correct eventual mistakes; they are available in the project home page. Comprehensive research in the annotation database (search) SABIA provides a search system that allows detailed searches in the annotation database. These searches may start from product, EC number, gene name, synonyms, PSORT, sequence, conserved or hypothetical sequence in the PSORT, ID, GI, InterPro ID or name, COG ID, product or functional classification, EC number, definition, classification, KEGG organism or gene name, and E. coli gene or products. These searches allow filtering through strings that differ from the pattern informed by the annotator, so that ORFs with similar and relevant characteristics are rapidly found. Overlapping of ORFs To prevent large overlaps, a report is produced showing ORFs with overlapping bases, ordered according to the total number of common bases (Figure 21). 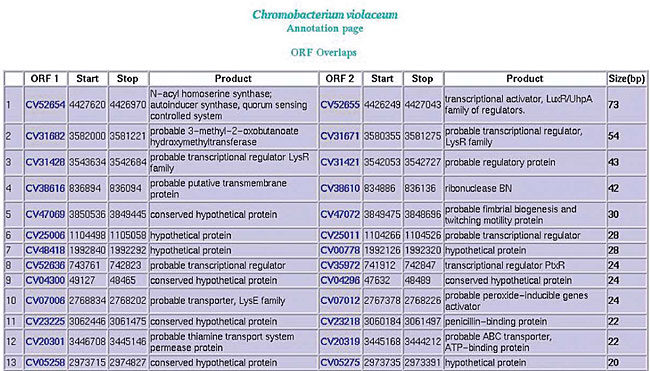
Figure 21. Overlap of a pair of ORFs.
Repeated gene names ORFs are grouped by the gene name. Names common to two or more ORFs are highlighted and a revision in the annotation is suggested. KEGG and EC number The EC list generated by SABIA is used to improve the annotation quality, by comparing the product name suggested by the annotator with the name recommended by the IUBMB (International Union of Biochemistry and Molecular Biology). The EC number is also used, during the automatic annotation process, to overview the detection of ORFs participating in the numerous steps of metabolic pathways (Figures 22 and 23). 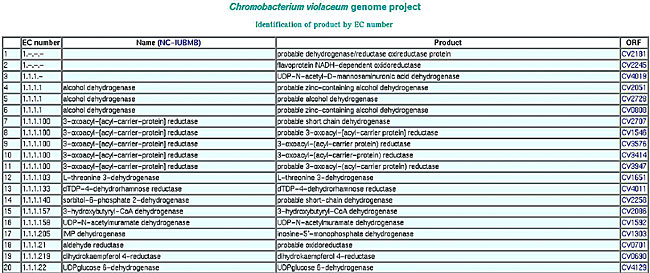 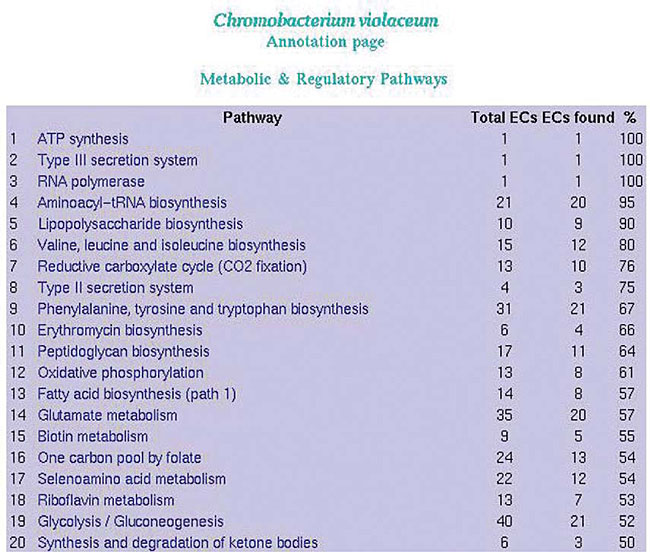
Figure 23. List of all metabolic pathways using KEGG.
Distribution of ORFs based on similarity SABIA presents the ORFs distribution by organism, based on the best KEGG hits. For each organism there is a total listing of ORFs and the percentage of the total, compared to the one currently annotated. High correlations suggest a greater similarity between organisms (Figure 24). 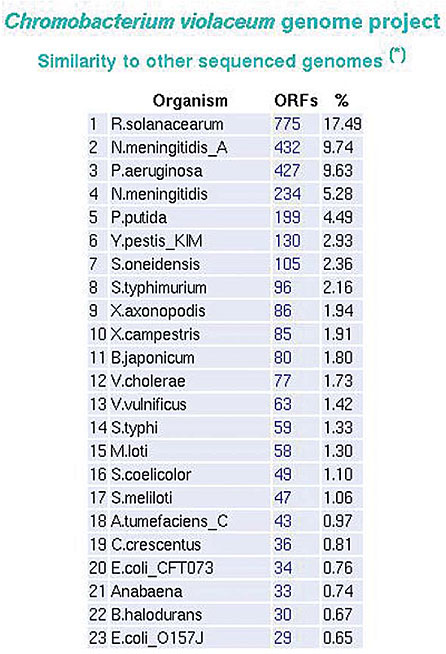
Figure 24. ORF distribution based upon KEGG hits.
Paralogous families To find ORFs with a high degree of identity (paralogous) a blastp is executed among all ORFs, with a expected default value of E-05, a minimum identity percentage of 50%, and 60% query coverage. ORFs with the best hits are grouped. Motifs in hypothetical and conserved hypothetical ORFs InterPro motifs and COG-defined products arising from automatic annotation are recovered for hypothetical and conserved hypothetical ORFs. In case the definitions in these two blocks are similar, the annotator may review his annotation (Figure 25). 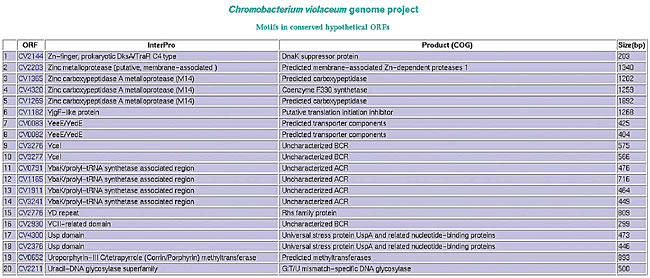
Figure 25. List of conserved hypothetical ORFs and their InterPro and COG products.
COG - clusters of orthologous groups of proteins SABIA produces a report based on the ORFs functionally classified by the COG. A general vision of the distribution and the percentage of total for classified ORFs is provided after the categorization of each ORF (Figure 26). 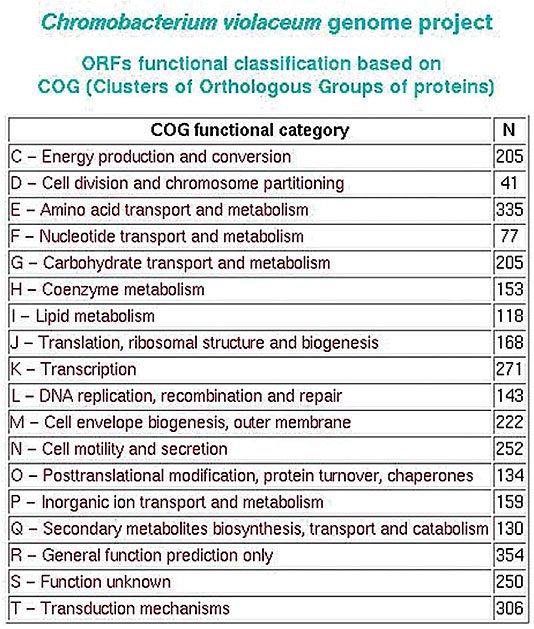
Figure 26. COG table.
ORF table The annotator may navigate selectively using the ORF list, ordered by their genome coordinates, containing their ID, gene names and products (Figure 27). 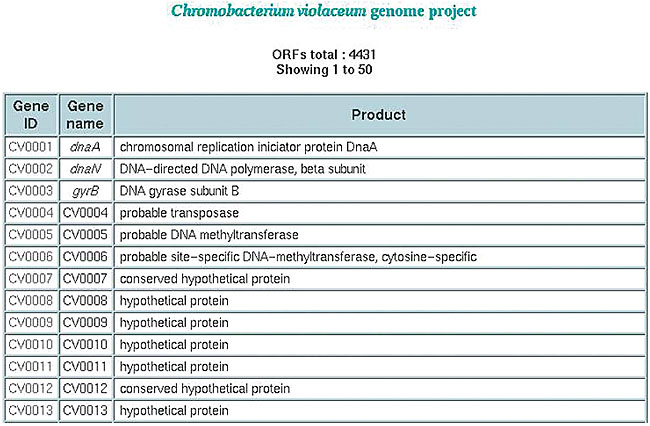
Figure 27. ORFs table.
SABIA has been shown to be a useful tool for the management, assembly and annotation of genomes. The information made available daily on the home page allowed strategies to be adopted and decisions to be made in an efficient manner, during the course of the project.The software was able to extract the main information needed for the assembly and closure of the genome from the various programs, making these tasks less difficult. For annotation, this tool was able to integrate information held in the best available database, and presented them to the users in an easy to use and gracefully intuitive format. SABIA proved to be a flexible and easily extensible system. It is being currently used in other genome projects under our coordination. Future work using SABIA will serve to test ever more sophisticated annotation methods. License We distribute the complete system (including source code) to non-commercial users under an open source license, as a resource for the academic community. Special commercial licenses are available on request. ACKNOWLEDGMENTS Research supported by the Ministério de Ciência e Tecnologia (MCT) through the Conselho Nacional de Desenvolvimento Científico e Tecnológico (CNPq). We are indebted to L.N.C.C. for administrative and technical support. REFERENCES Altschul, S.F., Gish, W., Miller, W., Myers, E.W. and Lipman, D.J. (1990). Basic local alignment search tool. J. Mol. Biol. 215: 403-410. Borodovsky, M. and McIninch, J. (1993). GeneMark: parallel gene recognition for both DNA strands. Comput. Chem. 19: 123-133. Carraro, D.M., Camargo, A.A., Salim, A.C., Grivet, M., Vasconcelos, A.T. and Simpson, A.J. (2003). PCR-assisted contig extension; stepwise strategy for bacterial genome closure. Biotechniques 34: 626-628, 630-632. Delcher, A.L., Harmon, D., Kasif, S., White, O. and Salzberg , S.L. (1999). Improved microbial gene identification with GLIMMER. Nucleic Acids Res. 27: 4636-4641. Fleischmann, R.D., Adams, M.D., White, O., Clayton, R.A., Kirkness, E.F., Kerlavage, A.R., Bult, C.J., Tomb, J.-F., Dougherty, B.A., Merrick, J.M., McKenney, K., Sutton, G.G., FitzHugh, W., Fields, C.A., Gocayne, J.D., Scott, J.D., Shirley, R., Liu, L.I., Glodek, A., Kelley, J.M., Weidman, J.F., Phillips, C.A., Spriggs, T., Hedblom, E., Cotton, M.D., Utterback, T., Hanna, M.C., Nguyen, D.T., Saudek, D.M., Brandon, R.C., Fine, L.D., Fritchman, J.L., Fuhrmann, J.L., Geoghagen, N.S., Gnehm, C.L., McDonald, L.A., Small, K.V., Fraser, C.M., Smith, H.O. and Venter, J.C. (1995). Whole-genome random sequencing and assembly of Haemophilus influenzae Rd. Science 269: 468-470. Kanehisa, M. (1996). Toward pathway engineering: a new database of genetic and molecular pathways. Sci. Technol. 59: 34-38. Lowe, T. and Eddy, S.R. (1997). tRNAscan-SE: a Program for Improved Detection of Transfer RNA genes in genomic sequence. Nucleic Acids Res. 25: 955-964. Mulder, N.J., Apweiler, R., Attwood, T.K., Bairoch, A., Barrell, D., Bateman, A., Binns, D., Biswas, M., Bradley, P., Bork, P., Bucher, P., Copley, R.R., Courcelle, E., Das, U., Durbin, R., Falquet, L., Fleischmann, W., Griffiths-Jones, S., Haft, D., Harte, N., Hulo, N., Kahn, D., Kanapin, A., Krestyaninova, M., Lopez, R., Letunic, I., Lonsdale, D., Silventoinen, V., Orchard, S.E., Pagni, M., Peyruc, D., Ponting, C.P., Selengut, J.D., Servant, F., Sigrist, C.J.A., Vaughan, R. and Zdobnov, E.M. (2003). The InterPro Database, 2003 brings increased coverage and new features. Nucleic Acids Res. 31: 315-318. Nakai, K. and Kanehisa, M. (1991). Expert system for predicting protein localization sites in Gram-negative bacteria. Proteins: Struct. Funct. Genet. 11: 95-110. Riley, M. (1998). Genes and proteins of Escherichia coli K-12 (GenProtEC). Nucleic Acids Res. 26: 54. Saier, M.H. (1999). Genome archeology leading to the characterization and classification of transport proteins. Curr. Opin. Microbiol. 2: 555-561. Setubal, J. and Werneck, R. (2001). A program for building contig scaffolds in double-barreled shotgun genome sequencing. (www.lbi.ic.unicamp). Simpson, A.J.G. (2001). Genome sequencing networks. Nat. Rev. Genet. 2: 79-83. Tatusov, R.L., Koonin, E.V. and Lipman, D.J. (1997). A genomic perspective on protein families. Science 278: 631-637. |
|