![]()
![]()
![]()
![]()
![]()
![]()
![]()
![]()
![]()
![]()
![]()
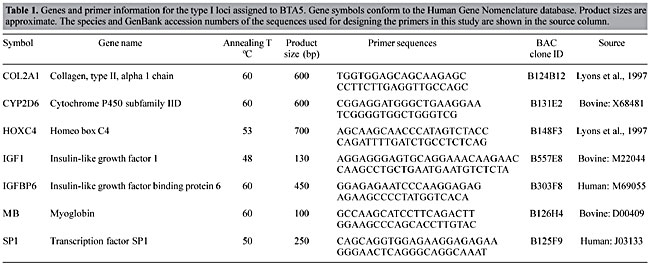
ABSTRACT. Seven genes were assigned by molecular cytogenetic methods to bovine chromosome 5. To accomplish this, specific primers were either publicly available or were designed from highly conserved regions of the publicly available mammalian gene sequences. The identity of the amplified segments was verified by sequencing and alignment with the published sequences. The optimized primers that amplified the desired bovine genes were used for screening a bovine bacterial artificial chromosome library. The positive clones were localized to a specific band of bovine chromosome 5 by fluorescence in situ hybridization. The genes HOXC4, SP1 and IGFBP6 were localized to band q21, COL2A1 was localized to bands q21-q23, IGF1 was localized to band q26, MB to band q31 and the gene CYP2D6 was localized to band q35. The cytogenetic assignment of SP1, IGFBP6, COL2A1, IGF1, MB and CYP2D6 is first reported here and the assignment of HOXC4 refines the previous assignment of this gene. The identification and localization of these genes further support the development of the human to bovine comparative map through characterizing the homologous segments conserved in the evolution of these species. This information will be useful for the future localization of genes that affect economically important traits in bovines. Key words: Comparative map, FISH, Bovine, Gene assignment INTRODUCTION The mapping of specific DNA sequences (genes, DNA markers and others) is one of the most important steps for the molecular genetic improvement of domestic animals and plants. It is especially useful for the cloning of economically important genes that are recalcitrant to cDNA cloning, as well as for the characterization of the mode of action, genetic interactions and transmission of genes. It is also very important for comparative analysis among taxa, allowing comparison across groups. Information generated can be used for marker-assisted selection in order to increase the power of artificial selection and to shorten the time and reduce the resources needed for genetic improvement. This is especially true for complex traits that are determined by quantitative trait loci (QTL) that may exhibit complex gene interactions. One of the molecular tools that has been instrumental in the cloning and localization of genes in cattle is bacterial artificial chromosome (BAC) resources. A bovine BAC library was constructed (Cai et al., 1995) using the pBeloBAC11 vector, originally containing 28,000 clones, with an average insert size of 146 kb, and a 70% probability of containing any single copy sequence. This library now contains 81,000 clones, with a 96% probability of containing a particular unique sequence (De Donato et al., 1999). The physical map of the human genome has been developed in great detail with the construction of BAC contigs covering most of the genome and with many anchored type I and II markers localized to specific chromosomal bands. High-resolution physical or linkage maps are not currently available for livestock species. In these species, the development of high-resolution physical maps will likely expedite linkage map development as well as the strategic mapping of targeted regions of the genome and the subsequent cloning of critical genes. Many genes and microsatellites have been assigned to cattle chromosomes by fluorescence in situ hybridization (FISH). This technique has also been used to order BAC clones using dual-color FISH on pachytene preparations for genes on bovine chromosomes 13 and 19 (Gallagher et al., 1998, 1999; Schläpfer et al., 1998). FISH has also been used to study the conservation of chromosome synteny from human to livestock species. Human chromosome paints have been used to define the homology of human chromosomes to cattle, pig and horse (Chowdhary et al., 1998). This approach, called Zoo-FISH, has served to identify and characterize the conservation of homologous chromosome segments and has enabled tentative localization of genes to specific conserved chromosomal regions based on the human assignment. For example, Zoo-FISH analysis with human paints from chromosome 17 has shown complete chromosome conservation of chromosomes 12 of swine, 19 of cattle, E1 of the domestic cat and 11 of the horse (Chowdhary et al., 1998). Thus, genes assigned to HSA17 are tentatively assigned to the other taxa for which conservation of synteny has been established by Zoo-FISH. Several QTLs have been localized to bovine chromosome 5, affecting ovulation rate (Kappes et al., 2000; Kirkpatrick et al., 2000), growth, carcass composition, and dressing percentage (Stone et al., 1999; Casas et al., 2000; Schrooten et al., 2000; MacNeil and Grosz, 2002). The exact localization and characterization of the genes responsible for these effects will require the development of higher resolution physical and genetic maps. We selected several genes to further develop the comparative map between human and cattle for this purpose. MATERIAL AND METHODS PCR-based library screening Seven human genes (Table 1), located on chromosomes 12 and 22, were selected for cytogenetic assignment to bovine chromosome 5 (BTA5). Human sequence data for five of the genes were obtained from the Entrez database (http://www.ncbi.nlm.nih.gov/Entrez) and was used to perform BLAST searches in the GenBank database (http://www3.ncbi.nlm.nih.gov/BLAST). The sequences from various mammalian species identified by the BLAST search were aligned using the software package CLUSTAL W Multiple Sequence Alignment Program (version 1.7, June 1997; Thompson et al., 1994). The primer-design software package OLIGO 5.0 (PREMIER Biosoft International) was used to select suitable primer pairs from the most conserved regions of the genes, according to their DG values, and hairpin and dimer formation characteristics. For two of the genes, COL2A1 and HOXC4, we used the primer pairs previously published from the comparative anchor tagged sequences (Lyons et al., 1997).
The PCR conditions for the designed primers were optimized using bovine genomic DNA from a standard cell line, JEW38 (a normal diploid fibroblast line developed from an Angus bull by the Laboratory of Genetics in the Department of Pathobiology at Texas A&M University). Primer pairs that amplified a unique product were used to screen the bovine BAC library using a previously described PCR systematic screening strategy (Cai et al., 1995). All PCRs were performed in a 30-µl volume containing BAC DNA, dNTPs, 1.5 mM magnesium chloride, 1X Taq reaction buffer, 1.0 U Taq DNA polymerase and 30 µl mineral oil, according to standard methods. Genomic DNA from cell line JEW38 was used as a positive control. Samples were electrophoresed onto 2-2.5% agarose gels, stained with ethidium bromide and the DNA was visualized under UV light. Sequencing The sequencing of the PCR products was carried out using an ABI 377 automated sequencer. PCR was performed using the BAC DNA of the positive clones identified with the primer pairs. The PCR products were cleaned with a QIAquick PCR purification kit (QIAGEN), and checked in a 2% agarose gel for contamination and concentration. They were then cycle sequenced using the forward or reverse PCR primers separately by adding 1-3 µl of clean PCR product, 0.5 µl of primer, 4 µl of sequencing mix containing the ABI PRISM BigDye terminator (PE Applied Biosystems) and water up to 10 µl. Cycle sequencing consisted of a hot start at 94ºC for 20 s and 25 cycles of denaturation at 94ºC for 10 s, annealing at 50ºC for 5 s and elongation-termination at 60ºC for 4 min. The resulting sequencing products were cleaned up using Sephadex G-50 (Sigma) columns and analyzed on the ABI 377 sequencer. The resulting sequences were used to perform BLAST searches to confirm the identity of the genes. The sequences were also aligned to the original sequence from which the primers were designed to determine the bovine-human sequence conservation and intron/exon boundaries, when appropriate. Cell culture and chromosome preparations Fibroblast cells from bovine cell line JEW38 were used to obtain mitotic cell suspensions. Cells were cultured in Dulbecco’s modified Eagle’s medium (Gibco, BRL) supplemented with amino acids, vitamins and fetal bovine serum. Bromodeoxyuridine (BrdU, 50 µg/ml in HBSS) was added to promote differential incorporation of BrdU into the AT-rich regions to enhance band contrast. After 20-24 h of incubation at 37ºC in 5% CO2, the medium was eliminated, the cells washed twice with HBSS, and new medium containing thymidine (3 µg/ml) was added to reactivate the cell cycle and avoid late incorporation of BrdU. The cells were harvested 5-6 h after the change of medium. Thirty minutes before harvesting, colcemid (40 ng/ml) was added to arrest the cells at metaphase and to break down the microtubules to obtain better chromosome spreading. Harvesting was accomplished by eliminating the medium, and treating with 75 mM KCl, as a hypotonic treatment, for 10 min. The cells were shaken off the flask and the cell suspension was centrifuged at 1,000 rpm for 5 min. Freshly made fixative (3 parts methanol:1 part glacial acetic acid) was added slowly. The fixative was changed twice and the cell suspension stored at -20ºC until needed. Two to three drops of cell suspension were added to clean wet slides and left to air-dry in order to prepare the chromosome spreads. Fluorescence in situ hybridization The chromosomal DNA on the slides was hydrated in 2X SSC (300 mM NaCl, 30 mM sodium citrate, HCl to pH 7.0) at 37ºC for 1 h. The DNA was then dehydrated in an ethanol series of 70, 85, 95 and 100% at room temperature for 2 min each. The chromosomal DNA was denatured by plunging the slides into 70% deionized formamide (American Bioanalytical), 2X SSC solution at 76ºC for 2 min. The chromosomal DNA was dehydrated again using the ethanol series for 2 min each. The slides were air-dried and stored for later use. BAC clone DNA was labeled by nick translation using a biotin (Bio-Nick kit, Gibco-BRL) translation kit. The labeled BAC DNA (100-200 ng) and bovine Cot I DNA (10 mg, Applied Genetics Laboratories) were precipitated together with 2.5X of 100% ethanol and 0.5X of 7.5 M ammonium acetate. The DNA was isolated by centrifugation at 13,000 rpm for 25 min at 4ºC. The pellet was washed with 70% ethanol, air-dried and resuspended overnight at 37ºC in 10 µl of hybridization mix (50% deionized formamide, 2X SSC, 10% dextran sulfate (Pharmacia), at pH 7.0). The probe DNA was denatured at 76ºC for 6 min and incubated for 30 min at 37ºC to allow the repetitive sequences to anneal. The probe DNA was then added to a pre-warmed slide under a sealed cover-glass, and left overnight at 37ºC in a humidity chamber. The next day, the slides were washed three times in 50% formamide, 2X SSC and three more times in 2X SSC at 40ºC for 5 min each, with agitation. Blocking solution (4X SSC, 3% bovine serum albumin, 0.05% Tween-20 and 0.08% Na-azide) was added to the slide to decrease nonspecific binding of antibodies and incubated at 37ºC for 15 min. The detection was performed using 1 µg/ml Cy3-streptavidin (Jackson ImmunoResearch Laboratories) diluted in detection solution (4X SSC, 1% BSA, 0.05% Tween-20) and incubated at 37ºC for 30 min. The slides were then washed three times with 4X SSC, 0.05% Tween-20 at 37ºC for 5 min each, with agitation. We used p-phenylenediamine dihydrochloride solution (1 mg/ml, pH 9.0) as an antifade, containing Hoechst 33258 (1.4 µg/ml) as a counterstain to produce fluorescent QBH bands. The biotinylated probe signal was visualized under an Olympus AX-70 epi-fluorescence photomicroscope using a triple-band-pass filter set to visualize Cy3 and Hoechst 33258 emission. Color negatives were taken on Fuji 400 or 200 ASA film and processed commercially. Chromosomes were identified according to their relative size and Q-band pattern. Chromosome-band designations were according to the cattle standard nomenclature (ISCNDA 1989, as modified by Popescu et al., 1996 and Hayes et al., 2000). RESULTS AND DISCUSSION Primer sets and amplification conditions used to amplify the targeted genes are shown in Table 1. Five primer sets were designed from bovine or human sequences. Ten BAC clones were tentatively identified as containing the desired gene on the basis of size similarity between the expected and observed PCR product. We selected one clone per gene for sequencing of the PCR fragments. The sequences were confirmed as originating from within the desired genes using the CLUSTAL W Multiple Sequence Alignment Program. These sequences were deposited in GenBank under the accession numbers AY197336-AY197339. Seven PCR-selected BAC clones used for FISH were assigned to different bands on BTA5 (Figure 1). The genes HOXC4, SP1 and IGFBP6 were localized to the same band, q21, while COL2A1 was localized to the terminal third of band q21 and to the proximal half of q23, due to the strong detected hybridization signal. The gene IGF1 was localized to band q26 and MB to band q31. Gene CYP2D6 was localized to the terminal two thirds of band q35. No secondary signals were detected in any of the hybridizations and all signals from each BAC were locus-specific within at least 20 scored cells. The cell shown in Figure 1G is seemingly tetraploid, a phenomenon that has previously been reported to occur in fibroblast cell lines (De Donato and Mimbela, 2002). The assignment of the gene IGFBP6 represents a new assignment for BTA5. The assignment of SP1, COL2A1, IGF1, MB, and CYP2D6 represents new cytogenetic assignments of these genes to specific bands of BTA5. Gene SP1 has previously been mapped to the RH map of this chromosome (Band et al., 2000), while the other four genes have previously been localized by linkage mapping (Barendse et al., 1997). The assignment of HOXC4 refines the previous assignment of this gene (Gunawardana and Fries, 1992), who localized the gene to bands q14 to q23. All of these genes, except HOXC4, have been previously localized to the RH map of BTA5 by our group (De Donato et al., 2003). Six additional genes or gene families have previously been cytogenetically assigned to BTA5 (Figure 1H) by FISH. Lactalbumin (LALBA) and four genes of the keratin gene complex (KRT@) from HSA12 have been assigned to band q21. KRT1L1 and Von Willebrand factor from HSA12 have been assigned to bands q31-32 and q35, respectively. In addition, acrosin and aconitase 2 from HSA22 have also been assigned to band q35 (http://locus.jouy.inra.fr/cgi-bin/lgbc/mapping/common/main.pl?BASE=cattle). Figure 2 shows the HSA12 and HSA22 to BTA5 comparative map (http://www.ncbi.nlm.nih.gov/LocusLink). The map shows some rearrangements between bovine chromosome 5 and human chromosomes 12 and 22. The short arm of HSA12 and most of its long arm show homology to the centromeric half and part of the most telomeric band of BTA5. In addition, the telomeric half of HSA22 shows homology to two BTA5 regions, one containing MB located in the interstitial region of the chromosome and the other containing five genes located in the most telomeric band. Finally, the most telomeric region of HSA12 shows homology to the telomeric region of BTA17 and the centromeric half of HSA22 shows homology to BTA17 and BTA22. 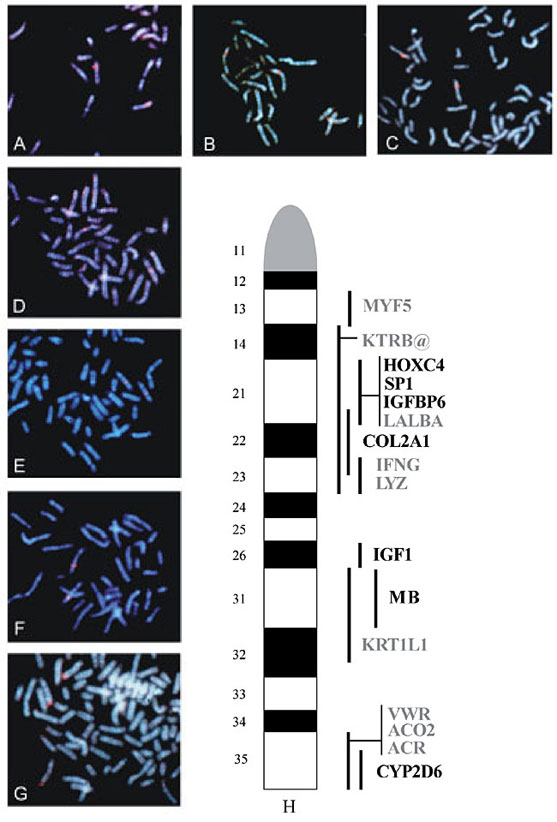
Figure 1. Molecular cytogenetic assignment of genes to bovine chromosome 5 using FISH. Assignment of HOXC4 (A), SP1 (B), IGFBP6 (C), COL2A1 (D), IGF1 (E), MB (F) and CYP2D6 (G) to metaphase chromosomes, showing QFH bands. Ideogram (H) of BTA5 showing the genes cytogenetically assigned in this study, as well as those previously assigned, shown in gray (http://locus.jouy.inra.fr/cgi-bin/lgbc/mapping/common/main.pl?BASE=cattle).
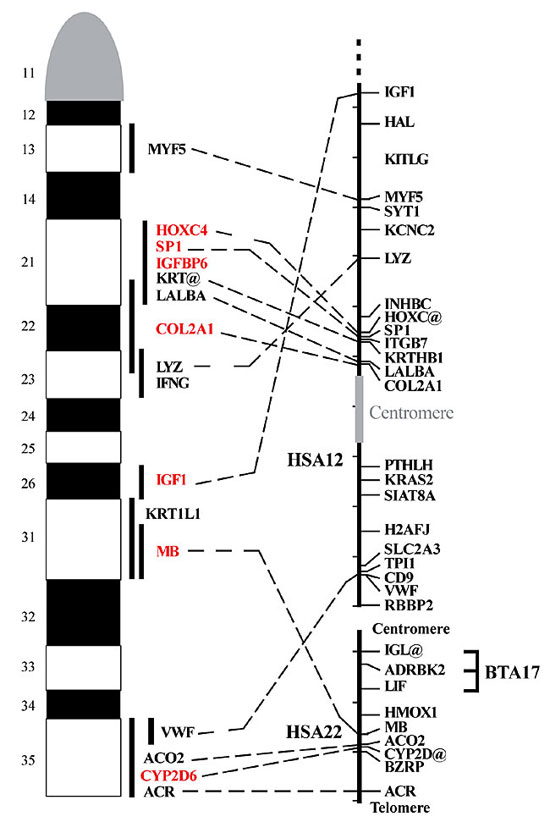
Figure 2. Human to bovine comparative map of BTA5. Cytogenetic locations are shown in the cattle chromosomes, and the physical locations derived from the human genome project are shown in the human chromosomes (http://www.ncbi.nlm.nih.gov/LocusLink). The map of HSA12 has been inverted for the comparison, to decrease the number of rearrangements. The centromere of HSA12 is shown as a gray box. The distance in the human maps, denoted by the small left bars, corresponds to 10 Mb.
The segment containing HOXC4, SP1, IGFBP6, LALBA and COL2A1 appears to have a conserved order in the human and bovine chromosomes. However, the human location for LYZ is transposed relative to the HOXC4-COL2A1 segment. The segment containing VWF is located in band q35 of BTA5. The segment containing IGF1 and MB in the interstitial region of BTA5 contains a breakpoint between HSA12 and HSA22, with one segment in the distal region of the long arm of HSA12 and the other located in the interstitial region of HSA22. It is likely that the most telomeric segment of HSA22 possesses a gene order that is conserved with that of the telomeric band of BTA5. A QTL affecting early growth in the mouse has been localized near marker D10Mit10 on mouse chromosome 10 (Cheverud et al., 1996). The human-mouse comparative map localizes this QTL close to human HAL on HSA12. Another QTL affecting early growth in mouse has been localized near marker D15Mit2 on mouse chromosome 15 (Cheverud et al., 1996). The human-mouse comparative map localizes this QTL close to human CYP2D@ on HSA22. It is possible that genes with similar effects exist in cattle. However, more precise estimates of the location of these QTL with respect to comparative genes are needed in both species before more definitive conclusions are possible. In cattle, QTL affecting ovulation rate, carcass weight, and dressing percentage have been localized to approximately 40 cM in the linkage map of BTA5 (Kappes et al., 2000; Kirkpatrick et al., 2000; MacNeil and Grosz, 2002). Genes IGFPB6, SP1 and COL2A1 have been localized in the vicinity of microsatellite BM321 in the RH map of BTA5 (De Donato et al., 2003), and this microsatellite is located at 38 cM in the linkage map (http://sol.marc.usda.gov/genome/cattle/cattle.html). In addition, QTL affecting size, stature, dressing percentage, rib bone, rib fat, rear udder height, udder depth, birth weight, USDA yield grade, fat depth, retail product yield and Warner-Bratzler shear force have been localized at different distances to the region around IGF1 (Stone et al., 1999; Casas et al., 2000; Schrooten et al., 2000; MacNeil and Grosz, 2002). Also, QTL affecting ovulation rate, chest width, body capacity and calving ease have been localized in the vicinity of microsatellite ETH152 (Schrooten et al., 2000; Kirkpatrick et al., 2000). This marker is located close to CYP2D in the RH map (De Donato et al., 2003). If homologous genes exist in humans, mapping and sequence information can extrapolate the human segments putatively harboring the genes onto bovine chromosomes. The identification and characterization of the genes underlying these QTL will allow genetic improvement for reproductive efficiency and performance traits in cattle, by using marker assisted selection. The gene IGF1 has been assigned to band q31 on goat chromosome 5 (Schibler et al., 1998), which disagrees with our assignment, if the cattle-to-goat band correspondence is assumed, according to previous reports at the cytogenetic (Evans et al., 1978; ISCNDA, 1989; Gallagher and Womack, 1992; Kaftanovskaya and Serov, 1994) and molecular levels (Crawford et al., 1995; Vaiman et al., 1996; Barendse et al., 1997; Kappes et al., 1997; Schibler et al., 1998; de Gortari et al., 1998). Further, four keratin family genes have been assigned to bands q14-23 in cattle (Fries et al., 1991), and one of these genes was assigned to band q25 in the goat (Schibler et al., 1998). Thus, some rearrangements might have occurred between these species, although the order of most genes appears to have been conserved. Only rearrangements involving bovine chromosomes 9 and 14 have been reported between cattle and goat autosomes (Crawford et al., 1995; Vaiman et al., 1996; Schibler et al., 1998; de Gortari et al., 1998). Comparisons of the bovine gene assignments with the physical assignments to pig chromosome 5 and the RH map assignment to domestic cat chromosome B-4 show evidence for some chromosomal rearrangements (http://www.genome.iastate.edu/main2.html and Murphy et al., 1999, respectively). The absence of mapped genes outside of the segments conserved in the human and bovine comparative maps also suggests the conservation of synteny among all three species. Rearrangements between cattle and pig seem complex and may involve multiple para- and peri-centromeric inversions. REFERENCES Band, M.R., Larson, J.H., Rebeiz, M., Green, C.A., Heyen, D.W., Donovan, J., Windish, R., Steining, C., Mahyuddin, P., Womack, J.E. and Lewin, H.A. (2000). An ordered comparative map of the cattle and human genomes. Genome Res. 10: 1359-1368. Barendse, W., Vaiman, D., Kemp, S.J., Sugimoto, Y., Armitage, S.M., Williams, J.L., Sun, H.S., Eggen, A., Agaba, M., Aleyasin, S.A., Band, M., Bishop, M.D., Buitkamp, J., Byrne, K., Collins, F., Cooper, L., Coppettiers, W., Denys, B., Drinkwater, R.D., Easterday, K., Elduque, C., Ennis, S., Erhardt, G., Ferretti, L. et al. (1997). A medium-density genetic linkage map of the bovine genome. Mamm. Genome 8: 21-28. Cai, L., Taylor, J.F., Wing, R.A., Gallagher, D.S., Woo, S.-S. and Davis, S.K. (1995). Construction and characterization of a bovine bacterial artificial chromosome library. Genomics 29: 413-425. Casas, E., Shackelford, S.D., Keele, K.W., Stone, R.T., Kappes, S.M. and Koohmaraie, M. (2000). Quantitative trait loci affecting growth and carcass composition of cattle segregating alternate forms of myostatin. J. Anim. Sci. 78: 560-569. Cheverud, J.M., Routman, E.J., Duarte, F.A.M., Van Swinderen, B., Cothran, K. and Perel, C. (1996). Quantitative trait loci for murine growth. Genetics 142: 1305-1319. Chowdhary, B.P., Raudsepp, T., Fronicke, L. and Scherthan, H. (1998). Emerging patterns of comparative genome organization in some mammalian species as revealed by Zoo-FISH. Genome Res. 8: 577-589. Crawford, A.M., Dodds, K.G., Ede, A.J., Pierson, C.A., Montgomery, G.W., Garmonsway, H.G., Beattie, A.E., Davies, K., Maddox, J.F., Kappes, S.M., Stone, R.T., Nguyen, T.C., Penty, J.M., Lord, E.A., Broom, J.E., Buitkamp, J., Schwaiger, W., Epplen, J.T., Matthew, P., Matthews, M.E., Hulme, D.J., Beh, K.J., McGraw, R.A. and Beattie, C.W. (1995). An autosomal genetic linkage map of sheep genome. Genetics 140: 703-724. De Donato, M. and Mimbela, I. (2002). Anormalidades citogenéticas de líneas estables de fibroblastos bovinos. Rev. Cient., FCV-LUZ 12: 388-394. De Donato, M., Gallagher, D.S., Davis, S.K., Ji, Y., Burzlaff, J.D., Stelly, D.M., Womack, J.E. and Taylor J.F. (1999). Physical assignment of microsatellite-containing BACs to bovine chromosomes. Cytogenet. Cell Genet. 87: 59-61. De Donato, M., Brenneman, R.A., Davis, S.K., Stelly, D.M., Womack, J.E. and Taylor, J.F. (2003). A methodological approach for the construction of a radiation hybrid map of bovine chromosome 5. Genet. Mol. Biol. (in press). de Gortari, M.J.D., Freking, B.A., Cuthbertson, R.P., Kappes, S.M., Keele, J.W., Stone, R.T., Leymaster, K.A., Dodds, K.G., Crawford, A.M. and Beattie, C.W. (1998). A second-generation linkage map of the sheep genome. Mamm. Genome 9: 204-209. Evans, H.J., Buckland, R.A. and Sumner, A.G. (1978). Chromosome homology and heterochromatin in goat, sheep and ox studied by banding techniques. Chromosoma 42: 383-402. Fries, R., Threadgill, D.W., Hediger, R., Gunawardana, A., Blessing, M., Jorcano, J.L., Stranzinger, G. and Womack, J.E. (1991). Mapping of bovine cytokeratin sequences to four different sites on three chromosomes. Cytogenet. Cell Genet. 57: 135-141. Gallagher, D.S. and Womack, J.E. (1992). Chromosome conservation in the Bovidae. J. Hered. 83: 287-298. Gallagher, D.S., Yang, Y.-P., Burzlaff, J.D., Womack, J.E., Stelly, D.M., Davis, S.K. and Taylor, J.F. (1998). Physical assignment of six type I anchor loci to bovine chromosome 19 by fluorescence in situ hybridization. Anim. Genet. 29: 130-134. Gallagher, D.S., Schlapfer, J., Burzlaff, J.D., Womack, J.E., Stelly, D.M., Davis, S.K. and Taylor, J.F. (1999). Cytogenetic alignment of the bovine chromosome 13 genome map by fluorescence in situ hybridization of human chromosome 10 and 20 comparative markers. Chromosome Res. 7: 115-119. Gunawardana, A. and Fries, R. (1992). Assignment of the HOX2 and HOX3 gene clusters to the bovine chromosome regions 19ql7-q23 and 5ql3-22. Anim. Genet. 23: 161-165. Hayes, H., Di Meo, G.P., Gautier, M., Laurent, P., Eggen, A. and Iannuzzi, L. (2000). Localization by FISH of the 31 Texas nomenclature type I markers to both Q- and R-banded bovine chromosomes. Cytogenet. Cell Genet. 90: 315-320. ISCNDA (1989). International system for cytogenetic nomenclature of domestic animals. Cytogenet. Cell Genet. 53: 65-79. Kaftanovskaya, H.M. and Serov, O.L. (1994). High resolution GTG-banded chromosomes of cattle, sheep, and goat: A comparative study. J. Hered. 85: 395-400. Kappes, S.M., Keele, J.W., Stone, R.T., McGraw, R.A., Sonstegard, T.S., Smith, T.P.L., Lopez-Corrales, N.L. and Beattie, C.W. (1997). A second-generation map of the bovine genome. Genome Res. 7: 235-249. Kappes, S.M., Bennett, G.L., Keele, J.W., Echternkamp, S.E., Gregory, K.E. and Thallman, R.M. (2000). Initial results of genomic scans for ovulation rate in a cattle population selected for increased twinning rate. J. Anim. Sci. 78: 3053-3059. Kirkpatrick, B.W., Byla, B.M. and Gregory, K.E. (2000). Mapping quantitative trait loci for bovine ovulation rate. Mamm. Genome 11: 136-139. Lyons, L.A., Laughlin, T.F., Copleland, N.G., Jenkins, N.A., Womack, J.E. and O’Brien, S.J. (1997). Comparative anchor tagged sequences (CATS) for integrative mapping of mammalian genomes. Nat. Genet. 15: 47-56. MacNeil, M.D. and Grosz, M.D. (2002). Genome-wide scans for QTL affecting carcass traits in Hereford x composite double backcross populations. J. Anim. Sci. 80: 2316-2324. Murphy, W.J., Menotti-Raymond, M., Lyons, L.A., Thompson, M.A. and O’Brien, S.J. (1999). Development of a feline whole genome radiation hybrid panel and comparative mapping of human chromosome 12 and 22 loci. Genomics 57: 1-8. Popescu, C.P., Long, S., Riggs, P., Womack, J.E., Schmutz, S., Fries, R. and Gallagher, D.S. (1996). Standardization of cattle chromosome nomenclature: report of the committee for the standardization of the cattle karyotype. Cytogenet. Cell Genet. 74: 259-261. Schibler, L., Vaiman, D., Oustry, A., Giraud-Delville, C. and Cribiu, E.P. (1998). Comparative gene mapping: a fine-scale survey of chromosome rearrangements between ruminants and humans. Genome Res. 8: 901-915. Schläpfer, J., Gallagher, D.S., Burzlaff, J.D., Womack, J.E., Stelly, D.M., Taylor, J.F. and Davis, S.K. (1998). Comparative mapping of bovine chromosome 13 by fluorescence in situ hybridization. Anim. Genet. 29: 265-272. Schrooten, C., Bovenhuis, H., Coppieters, W. and Van Arendonk, J.A. (2000). Whole genome scan to detect quantitative trait loci for conformation and functional traits in dairy cattle. J. Dairy Sci. 83: 795-806. Stone, R.T., Keele, J.W., Shackelford, S.D., Kappes, S.M. and Koohmaraie, M. (1999). A primary screen of the bovine genome for quantitative trait loci affecting carcass and growth traits. J. Anim. Sci. 77: 1379-1384. Thompson, J.D., Higgins, D.G. and Gibson, T.J. (1994). Clustal W: improving the sensitivity of progressive multiple sequence alignment through sequence weighting, position-specific gap penalties and weight matrix choice. Nucleic Acids Res. 22: 4673-4680. Vaiman, D., Schibler, L., Bourgeois, F., Oustry, A., Amigues, Y. and Cribiu, E.P. (1996). A genetic linkage map of the male goat genome. Genetics 144: 279-305. |
|